There are many ways to work out the order and privilege in which your product features should be brought to life. In fact, someone often tempts to go just with their gut. Feature scoring is a low-cost and convenient way to define the relative value of any number of things you may work on.

In our previous articles, we introduced an amazing prioritization framework — ICE scoring model that is now gaining increasing popularity among product teams. This time we'd like to describe one more powerful scoring model that is helpful in working out what to build next. The RICE prioritization method definitely will not leave you indifferent!
A powerful prioritization framework such as RICE model helps to consider each factor about a project and combine the factors in a consistent way.
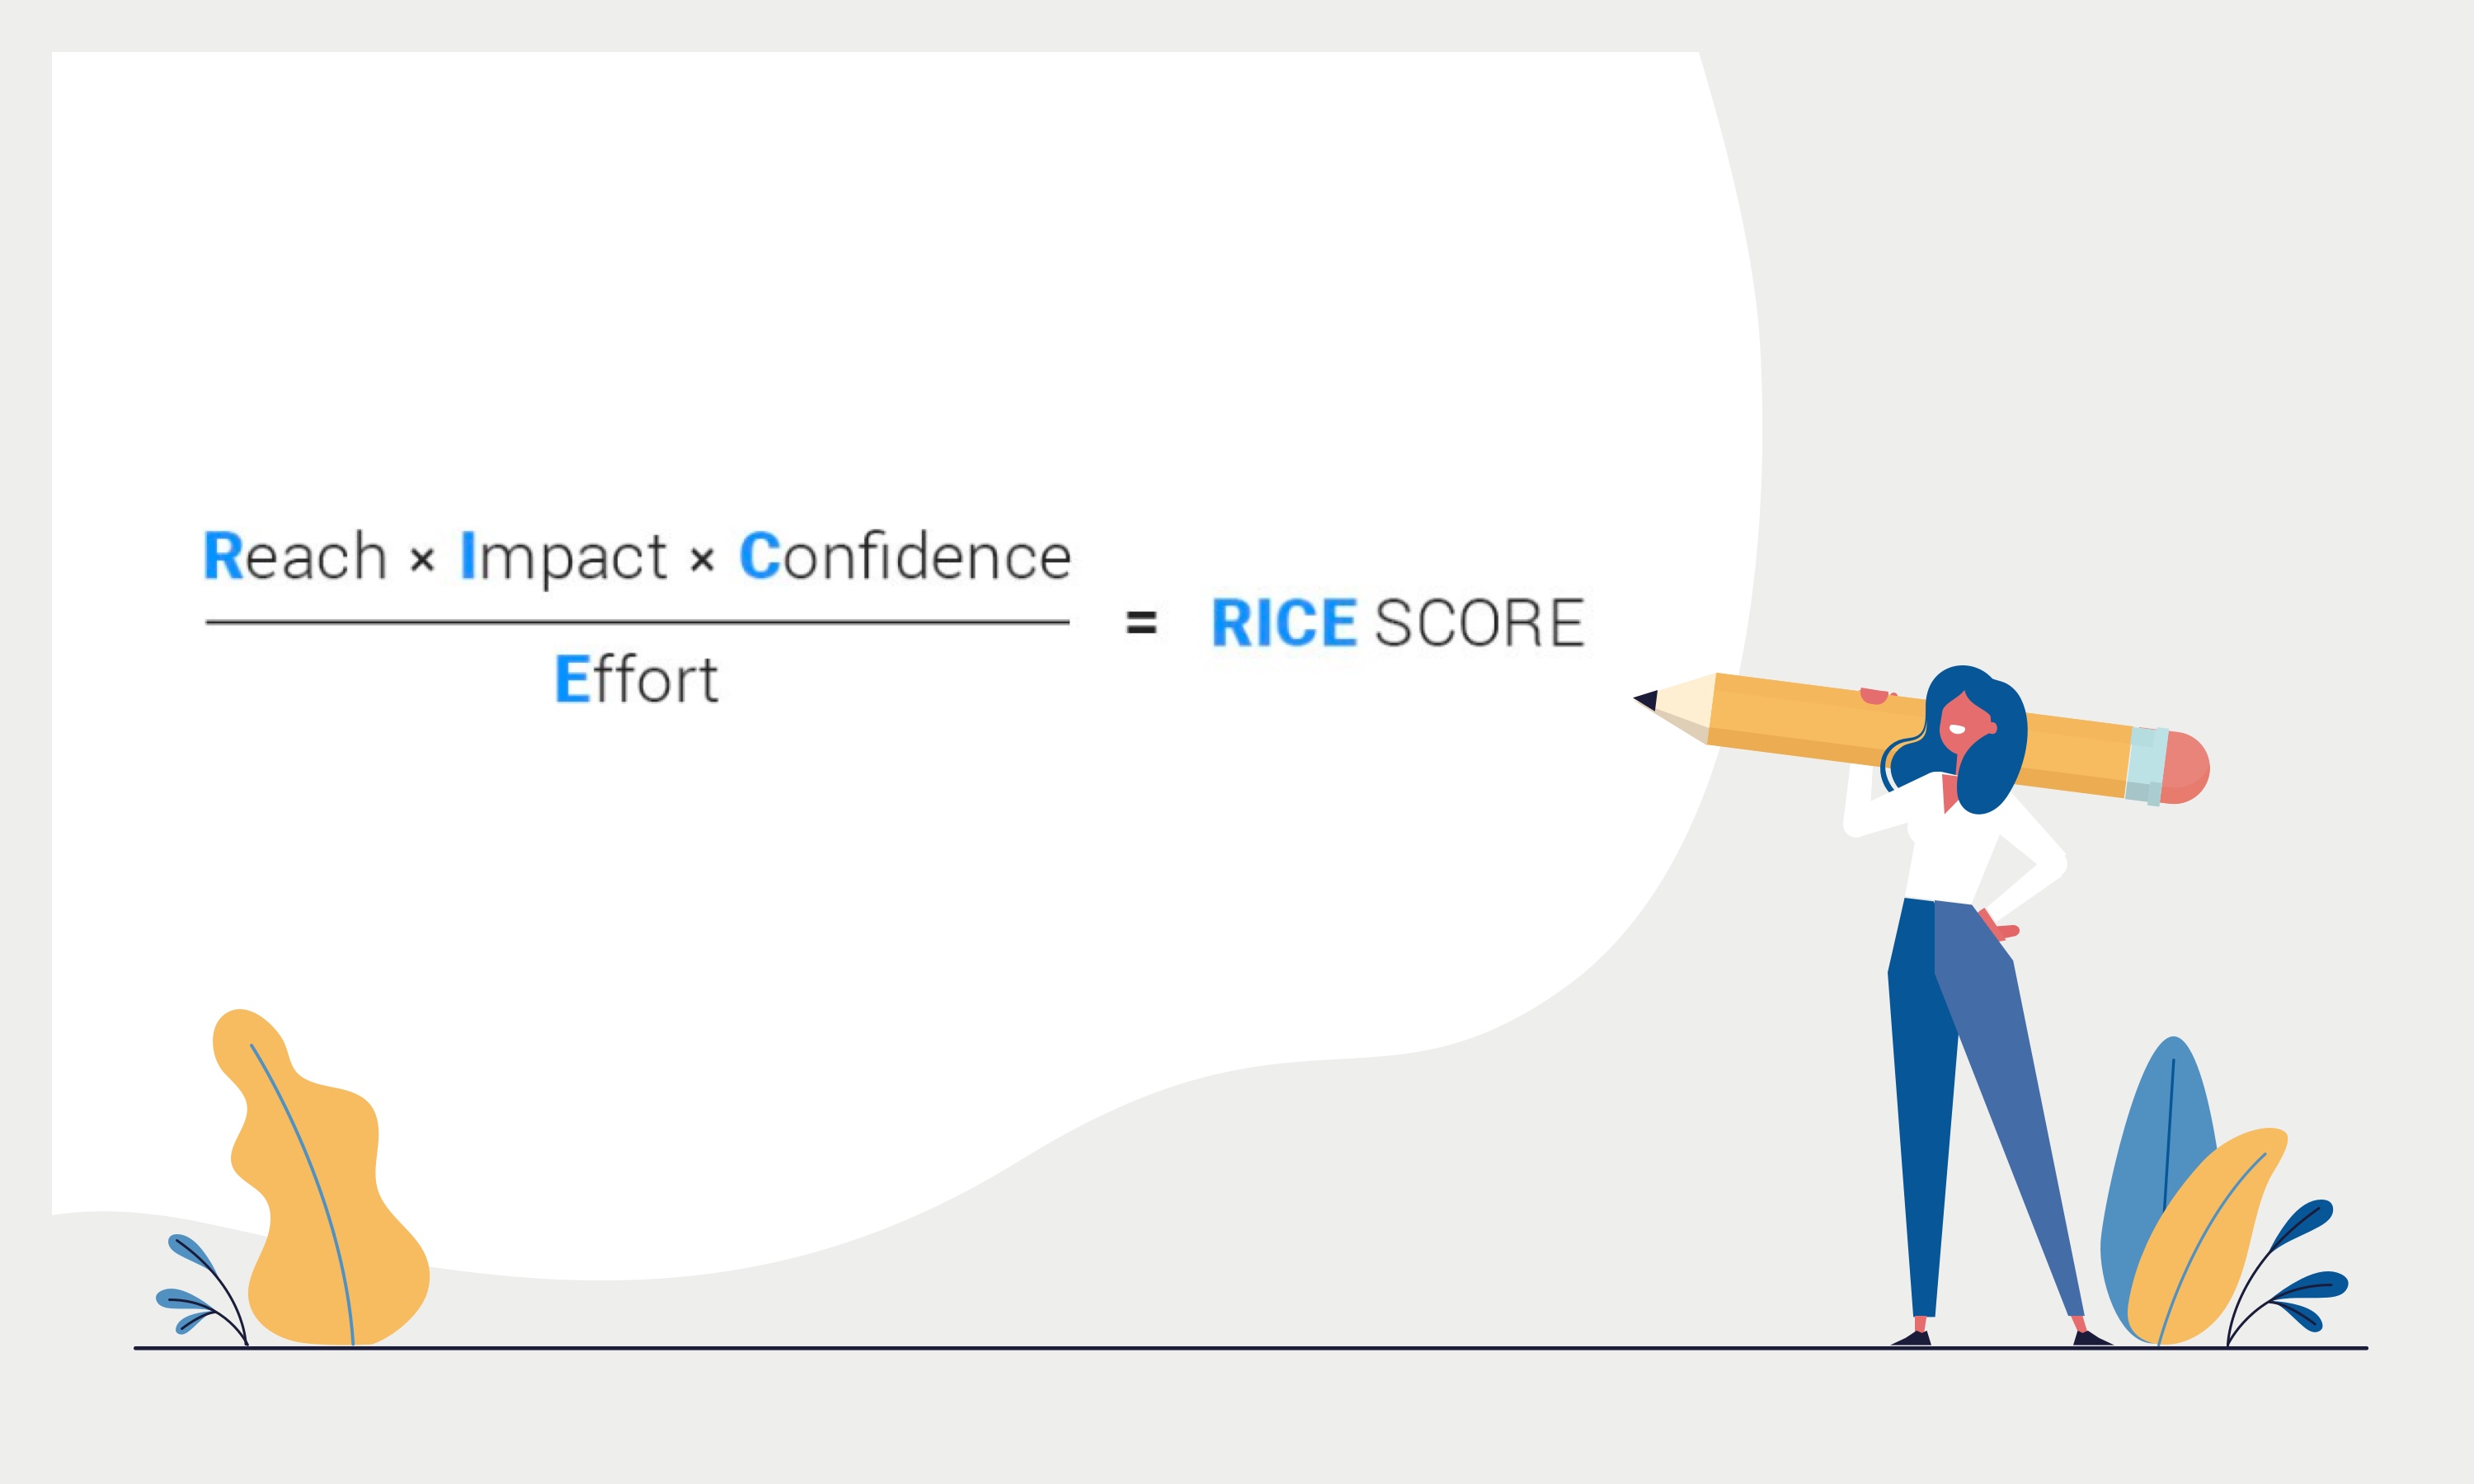
The abbreviation contains the following elements:
The RICE scoring approach allows you to take your «raw» features or initiatives, rank them using Reach, Impact, Confidence and Effort parameters, and then apply the scores you’ve come up with to decide which initiatives make the cut.
The first mentioning of the RICE concept comes to the messaging-software maker Intercom. The team of the service has developed the RICE prioritization model to improve its own internal decision-making processes.
They actually applied a wide range of different prioritization techniques but struggled to find a framework that worked for their unique set of project ideas.
They combined four factors (reach, impact, confidence, and effort), and identified a formula for quantifying and combining them.

This formula outputs a single score that could be applied consistently across even the most disparate types of ideas. It gives teams an objective way to determine which initiatives to prioritize on their product roadmap.
It is about the percentage of clients that will be impacted by the work.
Reach estimates how many people each feature or project will affect within a time period and how many clients will see the changes.
It's important to care about the real measurements from product metrics instead of using unclear numbers.
Example:
800 users per month will use the feature. 1000 start the onboarding and with 70% completion rate only 700 users will see this feature.
The Impact factor is expressed as a percentage. It refers to how much each user will be impacted. The Impact (“To what extent?”) reflects what contribution does the feature give to the product.
People understand Value in different ways in each product. In Hygger, for the current quarter, features get high Value if they:
These features help to catch new users during onboarding. However, most users are leaving on the second day.
In SaaS reality, 15% is an excellent indicator for day 1 retention. It actually means that 85% of people leave on the 2nd day. That's why it's crucial to propose the features that many new users will see as close to the registration time.
It's a usual picture when clients buy a subscription and ask to do some features. We are not in a hurry to do everything, we accumulate statistics for each feature (about how many clients asked for it) and do the most popular ones.
In order to succeed among 500+ project management systems on the market, we have to do something completely new. The best way is to also multiply the life of users or reduce the costs. We are looking for features with competitive advantages, that will be able to give clients a reason to come to us.
It's rather difficult to measure Impact. We choose from a multiple-choice scale:
These numbers get multiplied into the final score to scale it up or down.
Example:
Confidence comes to help in controlling when you think a project could have a huge impact but do not have data to back it up.It is also measured with a percentage scale.
Example:
The Effort parameter is estimated as a number of “person-months”, weeks or hours (depending on needs). This is about the work that a single team member can perform in a specific month. The more efforts, the worse it is.
Example:
RICE scoring can be applied in most contexts but does particularly well for working out the order in which you should tackle initiatives and the importance of every product feature (where some of them are critical while some are not).
For example, approaching the end of the year or a quarter, we often turn a very critical eye to what we are doing in the year (or a quarter) ahead. In this case, it's worth to revisit past assumptions and work out what’s really important for the next period.
You are able to try RICE scoring using Hygger functionality.
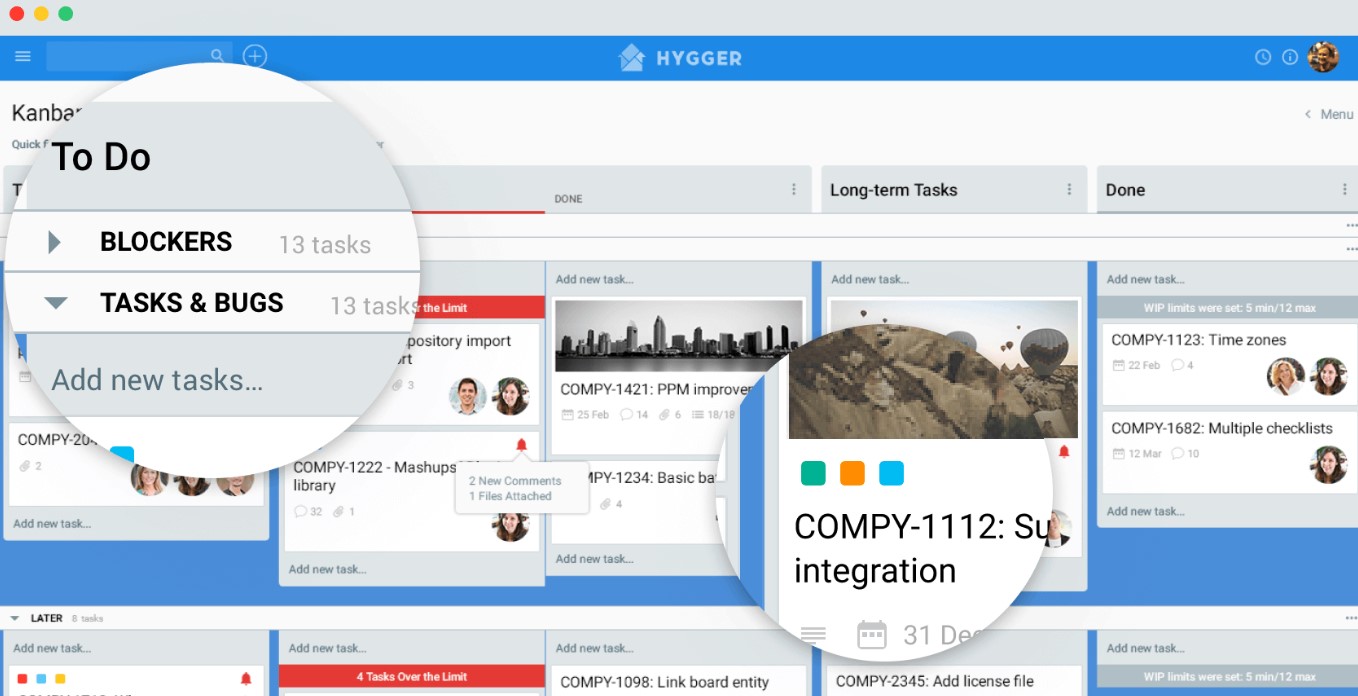
First, collect all your ideas and features on a Kanban-alike board. Powerful Swimlanes and Labels will help to structure them neatly. Use Columns to adjust the process of working with features.

Here's the example of a workflow:
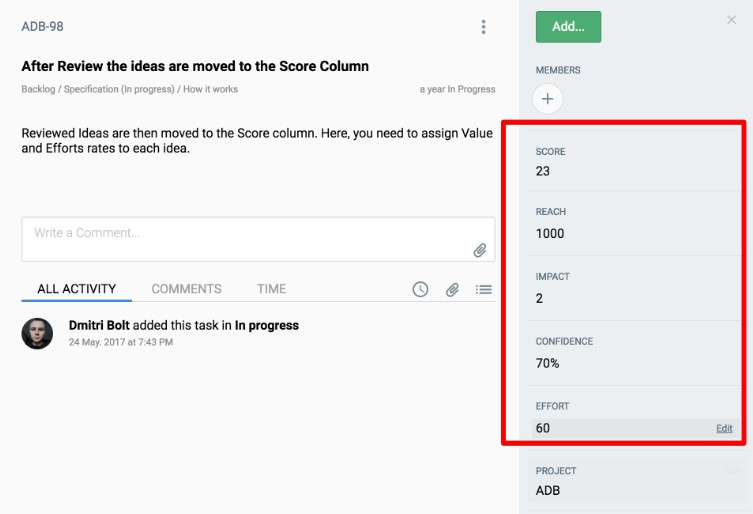
Select RICE option to start working with the framework. Evaluate every feature with Reach, Impact, Confidence, and Efforts and get the score.

View all the features in the table:

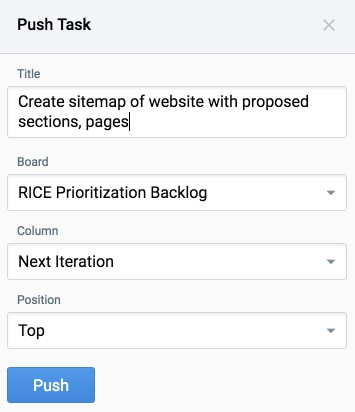
Next, you sort features by score and get some winners from the top. Then you send them to Development with Push option.

The RICE approach helps product teams to quickly create a consistent framework for evaluating the relative importance or value of a number of different project ideas objectively.
If you care about professional ways to set priorities, then RICE might be worth a try in your company.
Would you like to try the RICE prioritization method? Was this post helpful? Feel free to comment below.

In our previous articles, we introduced an amazing prioritization framework — ICE scoring model that is now gaining increasing popularity among product teams. This time we'd like to describe one more powerful scoring model that is helpful in working out what to build next. The RICE prioritization method definitely will not leave you indifferent!
A powerful prioritization framework such as RICE model helps to consider each factor about a project and combine the factors in a consistent way.
Introduction to RICE scoring
The abbreviation contains the following elements:
- Reach — about how many clients will be impacted?
- Impact — about what extent will each client be impacted?
- Confidence — about how confident are we in the three other scores?
- Effort — about how much time, effort or complexity is required?
The RICE scoring approach allows you to take your «raw» features or initiatives, rank them using Reach, Impact, Confidence and Effort parameters, and then apply the scores you’ve come up with to decide which initiatives make the cut.
RICE scoring model roots
The first mentioning of the RICE concept comes to the messaging-software maker Intercom. The team of the service has developed the RICE prioritization model to improve its own internal decision-making processes.
They actually applied a wide range of different prioritization techniques but struggled to find a framework that worked for their unique set of project ideas.
They combined four factors (reach, impact, confidence, and effort), and identified a formula for quantifying and combining them.

This formula outputs a single score that could be applied consistently across even the most disparate types of ideas. It gives teams an objective way to determine which initiatives to prioritize on their product roadmap.
REACH
It is about the percentage of clients that will be impacted by the work.
Reach estimates how many people each feature or project will affect within a time period and how many clients will see the changes.
It's important to care about the real measurements from product metrics instead of using unclear numbers.
Example:
800 users per month will use the feature. 1000 start the onboarding and with 70% completion rate only 700 users will see this feature.
IMPACT
The Impact factor is expressed as a percentage. It refers to how much each user will be impacted. The Impact (“To what extent?”) reflects what contribution does the feature give to the product.
People understand Value in different ways in each product. In Hygger, for the current quarter, features get high Value if they:
- Improve the trial-to-paid conversion
- Attract new users — Aha moment
These features help to catch new users during onboarding. However, most users are leaving on the second day.
In SaaS reality, 15% is an excellent indicator for day 1 retention. It actually means that 85% of people leave on the 2nd day. That's why it's crucial to propose the features that many new users will see as close to the registration time.
- Assist to keep current users
It's a usual picture when clients buy a subscription and ask to do some features. We are not in a hurry to do everything, we accumulate statistics for each feature (about how many clients asked for it) and do the most popular ones.
- Add value to the product, separating it from competitors
In order to succeed among 500+ project management systems on the market, we have to do something completely new. The best way is to also multiply the life of users or reduce the costs. We are looking for features with competitive advantages, that will be able to give clients a reason to come to us.
It's rather difficult to measure Impact. We choose from a multiple-choice scale:
- massive impact — 3
- high — 2
- medium — 1
- low — 0,5
- minimal — 0,25
These numbers get multiplied into the final score to scale it up or down.
Example:
- The 1st project: it will have a huge impact for all clients that see it, so the impact score is 3.
- The 2nd project: It will have a lesser impact on clients, so, the impact score is 1.
- The 3rd project: in terms of impact, it is somewhere in-between. The impact score is 2.
CONFIDENCE
Confidence comes to help in controlling when you think a project could have a huge impact but do not have data to back it up.It is also measured with a percentage scale.
Example:
- The 1st project: a project manager has some quantitative metrics to reach, user research for impact, and an estimate for efforts. The project gets a 100% confidence score.
- The 2nd project: the manager operates with data to support the reach and efforts, but there is no sureness about the impact. The project gets 80% confidence score.
- The 3rd project: Reach and impact data may be lower than estimated. The effort may be higher. The project gets a 50% confidence score.
EFFORT
The Effort parameter is estimated as a number of “person-months”, weeks or hours (depending on needs). This is about the work that a single team member can perform in a specific month. The more efforts, the worse it is.
Example:
- The 1st project will require a week of planning, 2 weeks of design and 3 weeks for engineering. The effort score is 2 person-months.
- The 2nd project will require several weeks of planning, a month for design and 2 months for engineering. The effort score is 4 person-months.
- The 3rd project will take just a week of planning, no need for design, and 1-2 weeks for engineering. The score is 1.
Where can we apply RICE?
RICE scoring can be applied in most contexts but does particularly well for working out the order in which you should tackle initiatives and the importance of every product feature (where some of them are critical while some are not).
For example, approaching the end of the year or a quarter, we often turn a very critical eye to what we are doing in the year (or a quarter) ahead. In this case, it's worth to revisit past assumptions and work out what’s really important for the next period.
Scoring and prioritizing with RICE
You are able to try RICE scoring using Hygger functionality.
First, collect all your ideas and features on a Kanban-alike board. Powerful Swimlanes and Labels will help to structure them neatly. Use Columns to adjust the process of working with features.

Here's the example of a workflow:
- Backlog (collecting ideas and features in this Сolumn)
- Next Up (moving the features you want to work on)
- Specification (gathering all requirements)
- Development (features are under development)
- Done (features were delivered to customers)
Select RICE option to start working with the framework. Evaluate every feature with Reach, Impact, Confidence, and Efforts and get the score.

View all the features in the table:

Next, you sort features by score and get some winners from the top. Then you send them to Development with Push option.

Final thoughts
The RICE approach helps product teams to quickly create a consistent framework for evaluating the relative importance or value of a number of different project ideas objectively.
If you care about professional ways to set priorities, then RICE might be worth a try in your company.
Would you like to try the RICE prioritization method? Was this post helpful? Feel free to comment below.

