Analytics is an integral part of a modern mobile application. Analytics allows you to collect user information to develop and improve the product.
Often, collecting information reduces application performance. The process additionally loads the CPU and memory, and this is a high price. Slow operation of the application can cause negative user reviews, lower the rating and lead to loss of audience.
Our android team faced with this problem while working on the next project, which was related to the news. We had to register the display of each news in the list.
Having received the task to collect analytics team quickly showed the result. The trigger for generating the event selected method onViewAttachedToWindow. Everything seems to be fine, but with a quick scrolling, the interface noticeably hung — something went wrong. The problem had to be solved.
Everyone perceives the suspension differently, so we needed facts and evidence. To measure the suspension, we selected FPS (Frames Per Second) indicator, and to measure the indicator?—?FPS-meter TinyDenser. After connecting the utility, the team received an objective confirmation of the problem — the indicator fell, sometimes quite noticeably: less than 30 frames per second, the screen recording with the utility turned on is shown in Fig. 1.
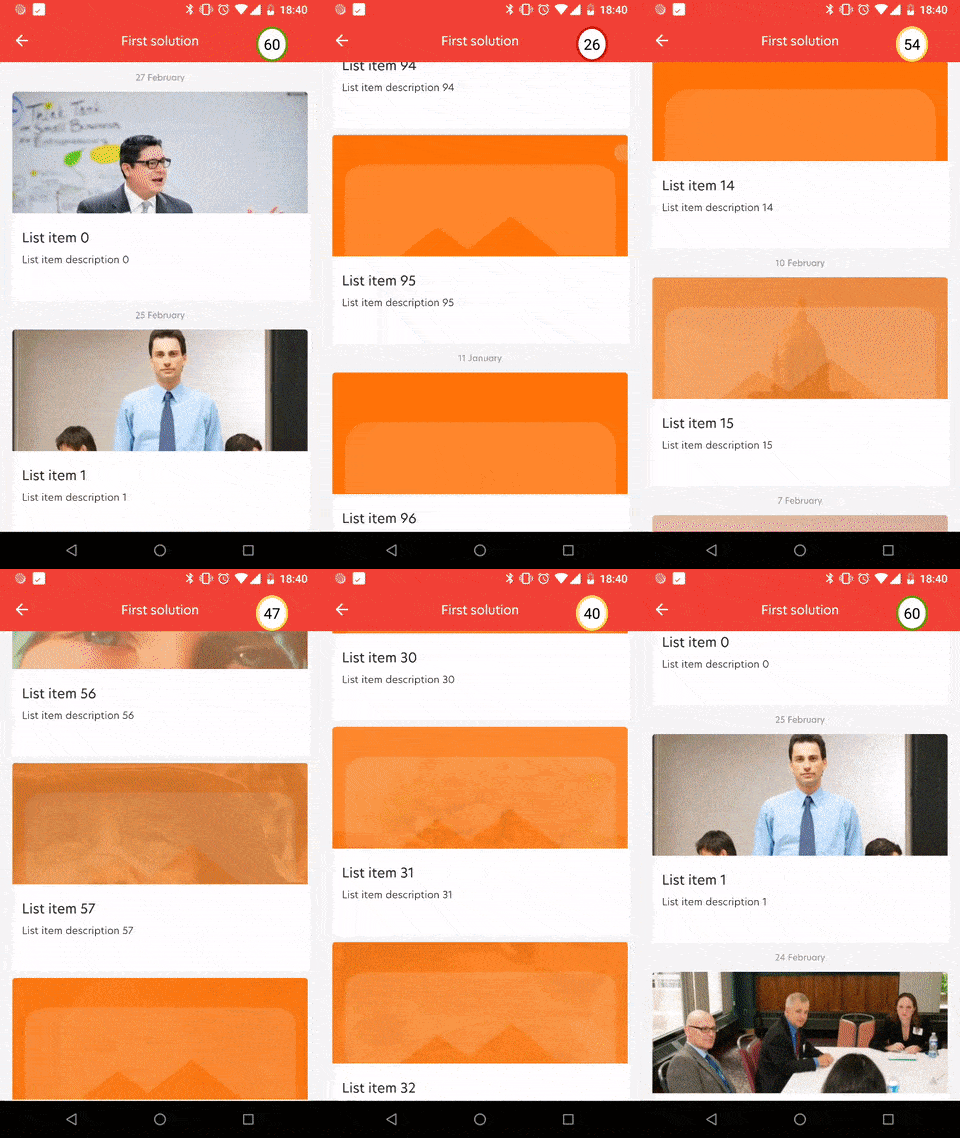 Figure 1. Screen recording before optimization
And if to postpone sending events until the user scrolls the list? «Hmmm», the team thought, and decided to create a queue of events and send them after the scroll stops. Everything is simple here: add OnScrollListener to RecyclerView and wait for newState equasl SCROLL_STATE_IDLE?—?the problem is partially solved.
The next step is to implement the accumulation of events and their dispatch.
To manage the queue, we created a class that was responsible for adding events to the queue and sending analytics to the service. For periodic sending selected ScheduledExecutorService with single thread that ran Runnable every second, time was chosen empirically.
This immediately yielded results, a significant increase in FPS. In principle, the problem was solved, in Figure 2 we see the result of the application after the second attempt. But there was one problem left — events were sent to the service, which led to the frequent generation of class objects Intent, and it additionally burdened GC and delivered «amenities» in the form stop-the-world pauses.
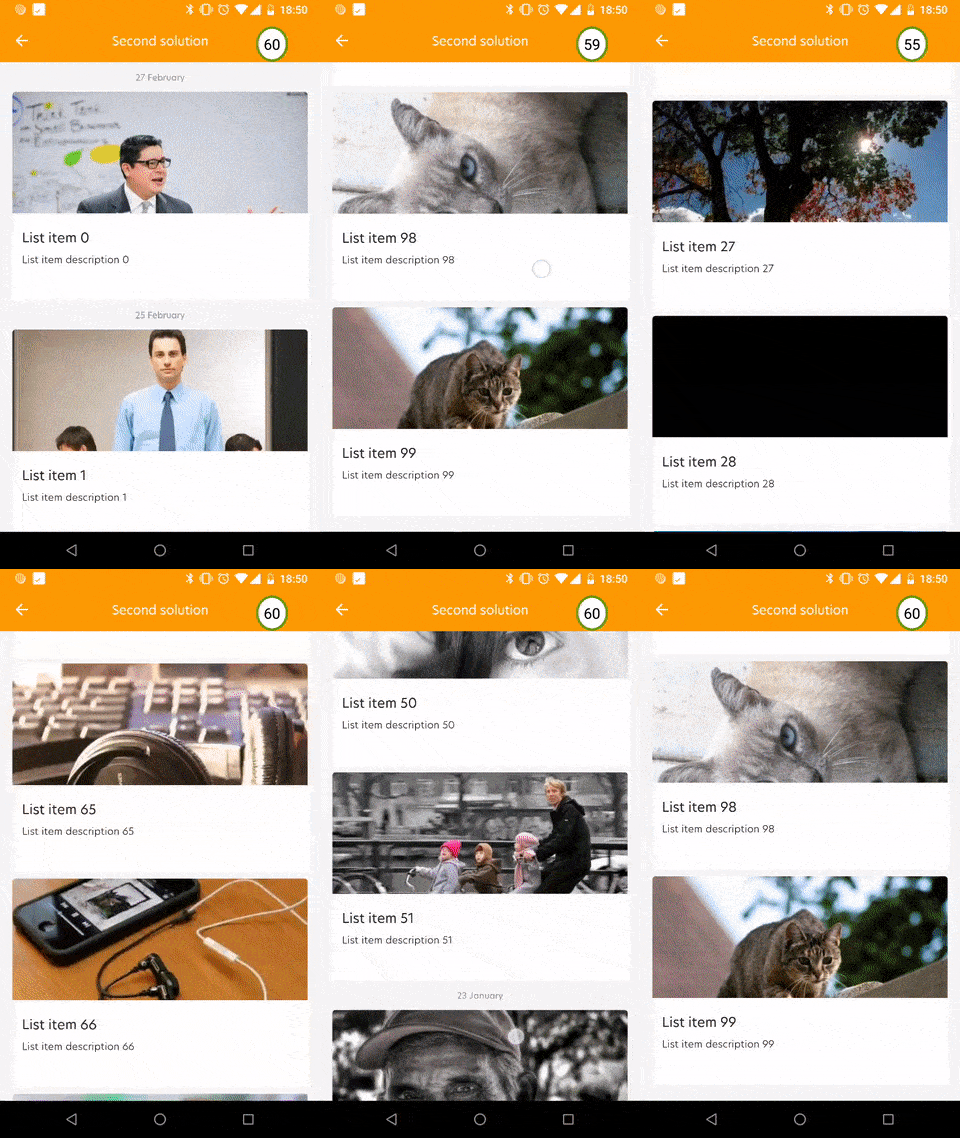 Figure 2. Screen recording after the second attempt
«Sending not one event at a time, but a list of events is another wonderful idea,» the team thought. After a short refinement of the class, the team implemented the dispatch of events by the list and received stable values of the indicator at the level of 55-60 frames per second (Figure 3).
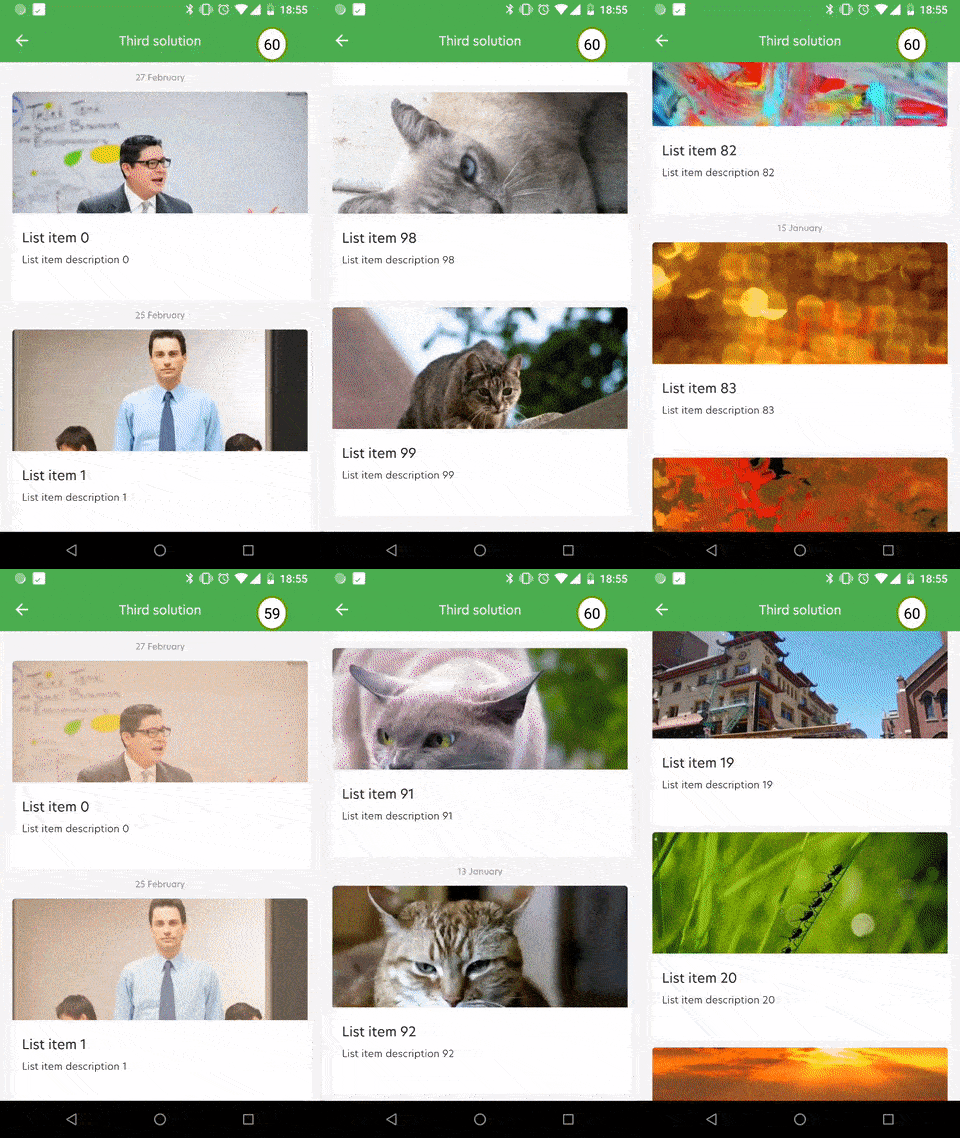
Figure 3. Screen recording after the third attempt
The trivial task of collecting analytics turned into an interesting and informative process, during which the team pumped its skills in researching application performance problems and finding ways to solve them. I hope our experience is useful for both beginners and experienced developers.
Our team settled on the third option, but this is not the only thing that could be applied.
In the current implementation, when the method is triggered onViewAttachedToWindow the news is transformed into an analytics event object, respectively, the creation of a new object. One of the possible solutions is to postpone the conversion until the moment of sending: to accumulate in the queue not the events, but the list elements themselves. Then the conversion will occur when the scroll is in the mode SCROLL_STATE_IDLE. You could also create an object pool for events. Together, these actions can give an additional increase in application performance.
Often, collecting information reduces application performance. The process additionally loads the CPU and memory, and this is a high price. Slow operation of the application can cause negative user reviews, lower the rating and lead to loss of audience.
Our android team faced with this problem while working on the next project, which was related to the news. We had to register the display of each news in the list.
Attempt №1
Having received the task to collect analytics team quickly showed the result. The trigger for generating the event selected method onViewAttachedToWindow. Everything seems to be fine, but with a quick scrolling, the interface noticeably hung — something went wrong. The problem had to be solved.
Everyone perceives the suspension differently, so we needed facts and evidence. To measure the suspension, we selected FPS (Frames Per Second) indicator, and to measure the indicator?—?FPS-meter TinyDenser. After connecting the utility, the team received an objective confirmation of the problem — the indicator fell, sometimes quite noticeably: less than 30 frames per second, the screen recording with the utility turned on is shown in Fig. 1.

Attempt №2
And if to postpone sending events until the user scrolls the list? «Hmmm», the team thought, and decided to create a queue of events and send them after the scroll stops. Everything is simple here: add OnScrollListener to RecyclerView and wait for newState equasl SCROLL_STATE_IDLE?—?the problem is partially solved.
class IdleStateScrollListener(private val analyticsFacade: AnalyticsFacade)
      : RecyclerView.OnScrollListener() {

    fun onScrollStateChanged(recyclerView: RecyclerView, newState: Int) {
        analyticsFacade.setPending(newState != RecyclerView.SCROLL_STATE_IDLE)
    }
}
The next step is to implement the accumulation of events and their dispatch.
To manage the queue, we created a class that was responsible for adding events to the queue and sending analytics to the service. For periodic sending selected ScheduledExecutorService with single thread that ran Runnable every second, time was chosen empirically.
This immediately yielded results, a significant increase in FPS. In principle, the problem was solved, in Figure 2 we see the result of the application after the second attempt. But there was one problem left — events were sent to the service, which led to the frequent generation of class objects Intent, and it additionally burdened GC and delivered «amenities» in the form stop-the-world pauses.

Attempt №3
«Sending not one event at a time, but a list of events is another wonderful idea,» the team thought. After a short refinement of the class, the team implemented the dispatch of events by the list and received stable values of the indicator at the level of 55-60 frames per second (Figure 3).

Figure 3. Screen recording after the third attempt
Conclusions
The trivial task of collecting analytics turned into an interesting and informative process, during which the team pumped its skills in researching application performance problems and finding ways to solve them. I hope our experience is useful for both beginners and experienced developers.
Could we done somethings else?
Our team settled on the third option, but this is not the only thing that could be applied.
In the current implementation, when the method is triggered onViewAttachedToWindow the news is transformed into an analytics event object, respectively, the creation of a new object. One of the possible solutions is to postpone the conversion until the moment of sending: to accumulate in the queue not the events, but the list elements themselves. Then the conversion will occur when the scroll is in the mode SCROLL_STATE_IDLE. You could also create an object pool for events. Together, these actions can give an additional increase in application performance.

