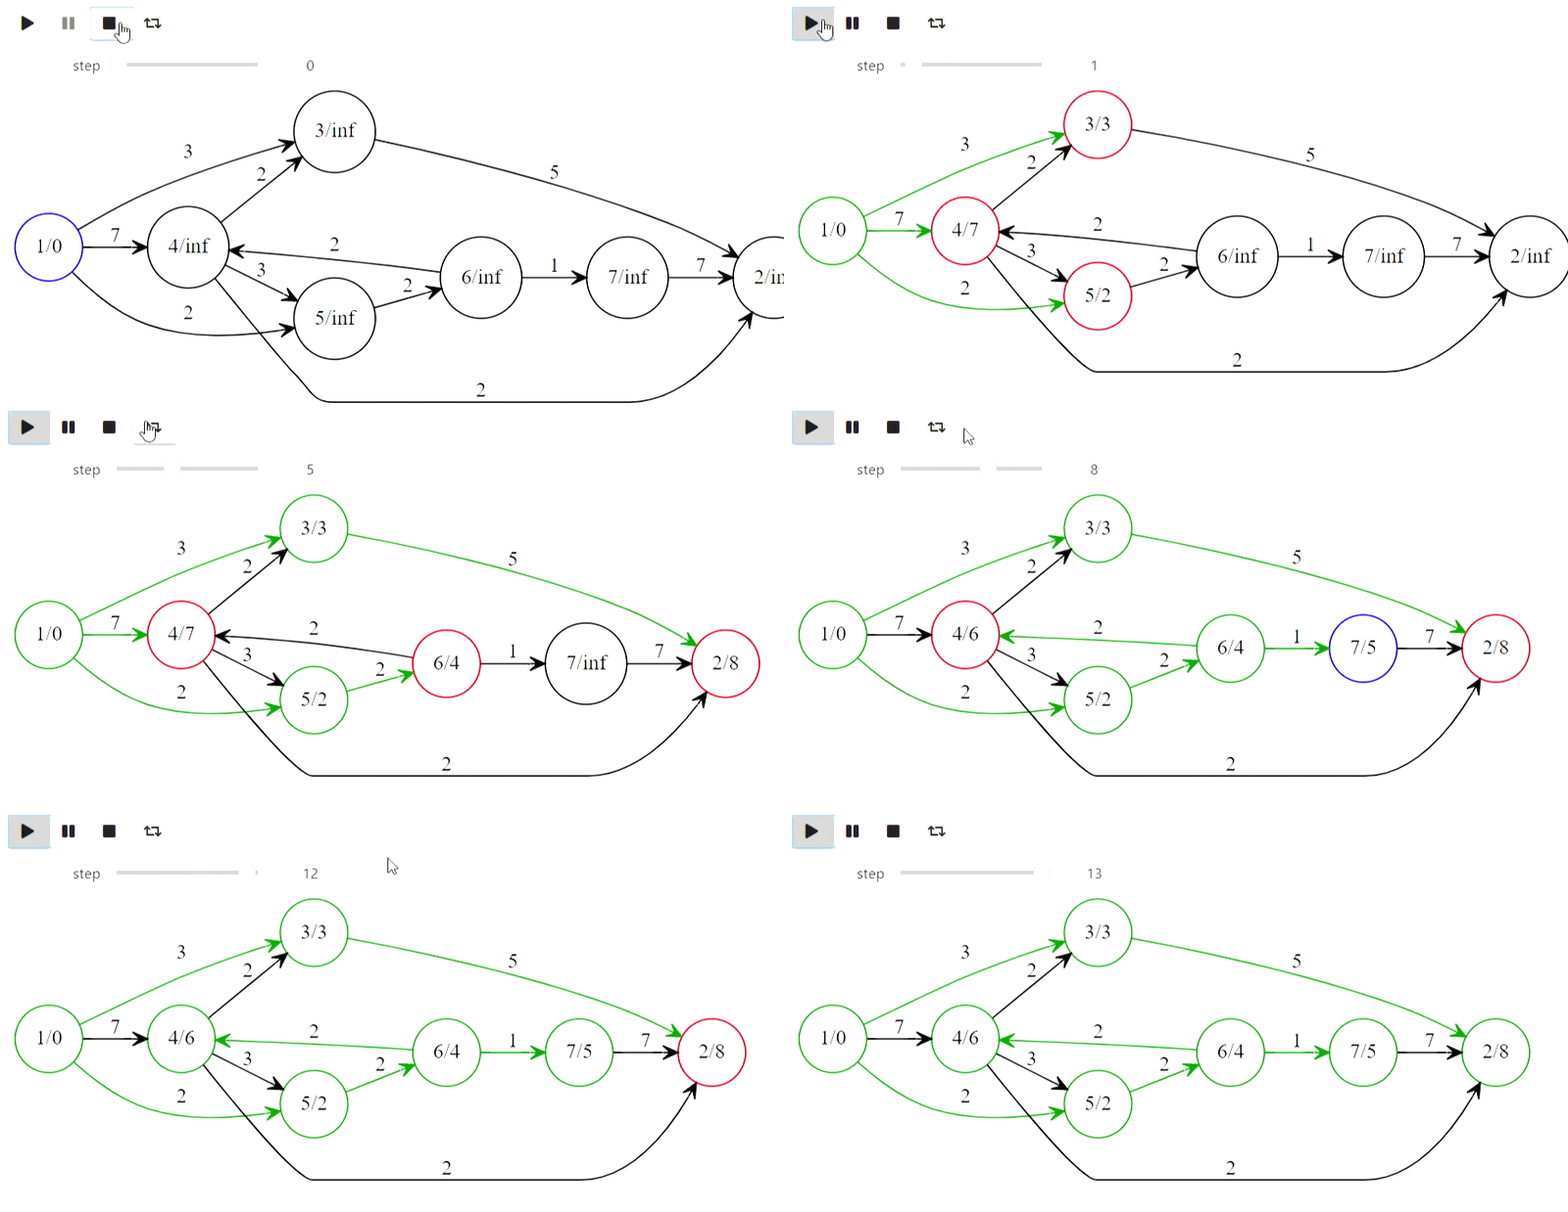
Предисловие
Все примеры, которые будут представлены в статье, можно найти вот в этом ноутбуке, основной материал будет спрятан под спойлерами из-за того, что кода и gif довольно много. Чтобы воспроизвести часть примеров, которые будут представлены в любом случае понадобится этот репозиторий из-за того, что он содержит некоторые промежуточные утилиты.
Чем анимируем
Под Jupyter есть набор виджетов (ipywidgets), которые представляю собой различного рода инструменты управления, взаимодействуя с модулем IPython.display предоставляют интерактивную визуализацию. Следующий код представляет все ключевое взаимодействие с виджетами, с помощью которого можно сделать интерактивную анимацию на содержимом списка:
from ipywidgets import interact, interactive, fixed, interact_manual
import ipywidgets as widgets
from IPython.display import display


def step_slice(lst, step):
    return lst[step]


def animate_list(lst, play=False, interval=200):
    slider = widgets.IntSlider(min=0, max=len(lst) - 1, step=1, value=0)
    if play:
        play_widjet = widgets.Play(interval=interval)
        widgets.jslink((play_widjet, 'value'), (slider, 'value'))
        display(play_widjet)
        # slider = widgets.Box([play_widject, slider])
    return interact(step_slice,
                    lst=fixed(lst),
                    step=slider)
Вот что получится, если подать функции animate_list список из целых чисел:
a = [10, 9, 8, 7, 6, 5, 4, 3, 2, 1]
animate_list(a, play=True, interval=200);
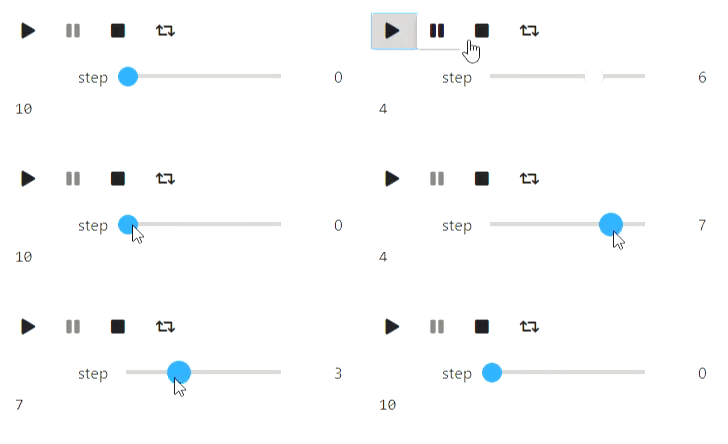
Чтобы продемонстрировать работу какого-либо алгоритма с помощью animate_list нужно сгенерировать промежуточные состояния алгоритма и сохранить их визуальное представление в нужном формате.
Тектовые анимации
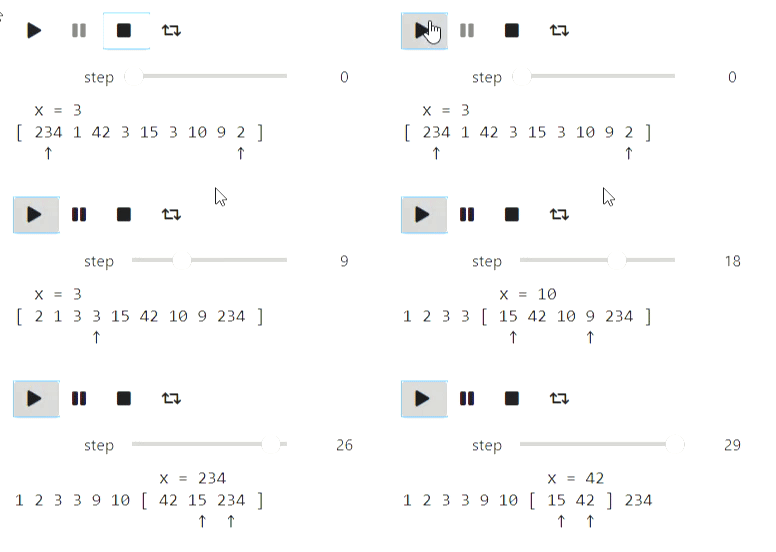
Базовые алгоритмы для работы с последовательностями/массивами достаточно текстового представления. У меня к сожалению были проблемы с базовыми строками, которые отказывались обрабатывать перевод строки, в результате я использовал IPython.display.Code. Начнем с классической быстрой сортировки.
from IPython.display import Code
import random

def qsort_state(array, left, right, x, p, q):
    extended_array = list(map(str, array[:left])) + ['['] + list(map(str, array[left: right])) + [']'] + list(map(str, array[right:]))
    offset_x = sum(list(map(len, extended_array[:left]))) + left + 2
    zero_line = ''.join([' ' for i in range(offset_x)]) + f'x = {x}'
    first_line = ' '.join(extended_array)
    offset_p = sum(list(map(len, extended_array[:p + 1]))) + p + 1 + len(extended_array[p + 1]) // 2
    offset_q = sum(list(map(len, extended_array[:q + 1]))) + q + 1 + len(extended_array[q + 1]) // 2
    second_line = ''.join([' ' if i != offset_p and i != offset_q else '^' for i in range(len(first_line))])

    return Code(zero_line + '\n' + first_line + '\n' + second_line)

def qsort(array, left, right, states):
    if right - left <= 1:
        return
    x = array[random.randint(left, right - 1)]
    p = left
    q = right - 1
    states.append(qsort_state(array, left, right, x, p, q))
    while p <= q:
        while array[p] < x:
            p += 1
            states.append(qsort_state(array, left, right, x, p, q))
        while array[q] > x:
            q -= 1
            states.append(qsort_state(array, left, right, x, p, q))
        if p <= q:
            array[p], array[q] = (array[q], array[p])
            states.append(qsort_state(array, left, right, x, p, q))
            p += 1
            q -= 1
            if p <= q:
                states.append(qsort_state(array, left, right, x, p, q))
    qsort(array, left, q + 1, states)
    qsort(array, p, right, states)
a = [234, 1, 42, 3, 15, 3, 10, 9, 2]
states = []
qsort(a, 0, len(a), states)
animate_list(states, play=True);
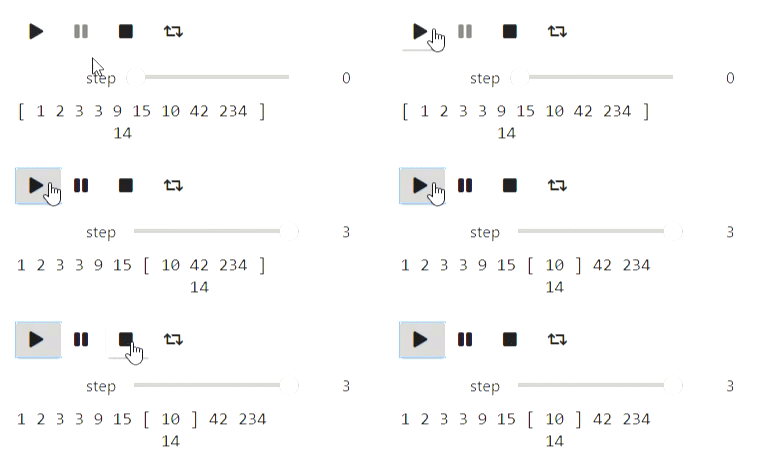
Похожим образом можно визуализировать и бинарный поиск
def bs_state(array, left, right, x):
    extended_array = list(map(str, array[:left])) + ['['] + list(map(str, array[left: right])) + [']'] + list(map(str, array[right:]))
    mid = (left + right) // 2
    offset_x = sum(list(map(len, extended_array[:mid + 1]))) + mid + 1
    return Code(' '.join(extended_array) + '\n' + ''.join([' ' for i in range(offset_x)]) + str(x))

# Эта версия бинарного поиска находит последний элемент, который
# меньше или равен искомого
states = []
left = 0
right = len(a)
x = 14
while right - left > 1:
    states.append(bs_state(a, left, right, x))
    mid = (left + right) // 2
    if a[mid] <= x:
        left = mid
    else:
        right = mid
states.append(bs_state(a, left, right, x))

animate_list(states, play=True, interval=400);
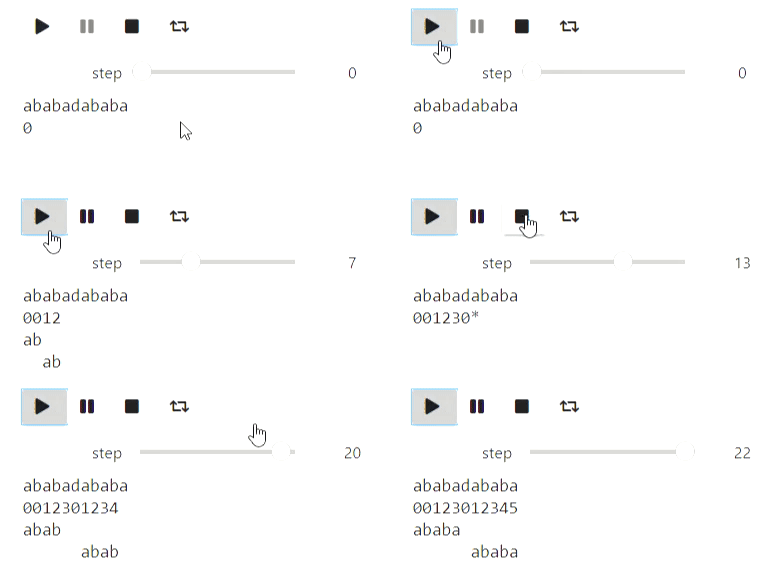
А вот пример для строк: процесс построения префикс-функции:
def prefix_function_state(s, p, k, intermidiate=False):
    third_string = ''.join([s[i] if i < k else ' ' for i in range(len(p))])
    fourth_string = ''.join([s[i] if i >= len(p) - k else ' ' for i in range(len(p))])
    return Code(s + '\n' + ''.join(list(map(str, (p + ['*'] if intermidiate else p ))))                   + '\n' + third_string + '\n' + fourth_string)

def prefix_function(s, states):
    p = [0]
    k = 0
    states.append(prefix_function_state(s, p, k))
    for letter in s[1:]:
        states.append(prefix_function_state(s, p, k, True))
        while k > 0 and s[k] != letter:
            k = p[k - 1]
            states.append(prefix_function_state(s, p, k, True))
        if s[k] == letter:
            k += 1
        p.append(k)
        states.append(prefix_function_state(s, p, k))
    return p

states = []
p = prefix_function('ababadababa', states)
animate_list(states, play=True);
Визуализация с использованием Matplotlib
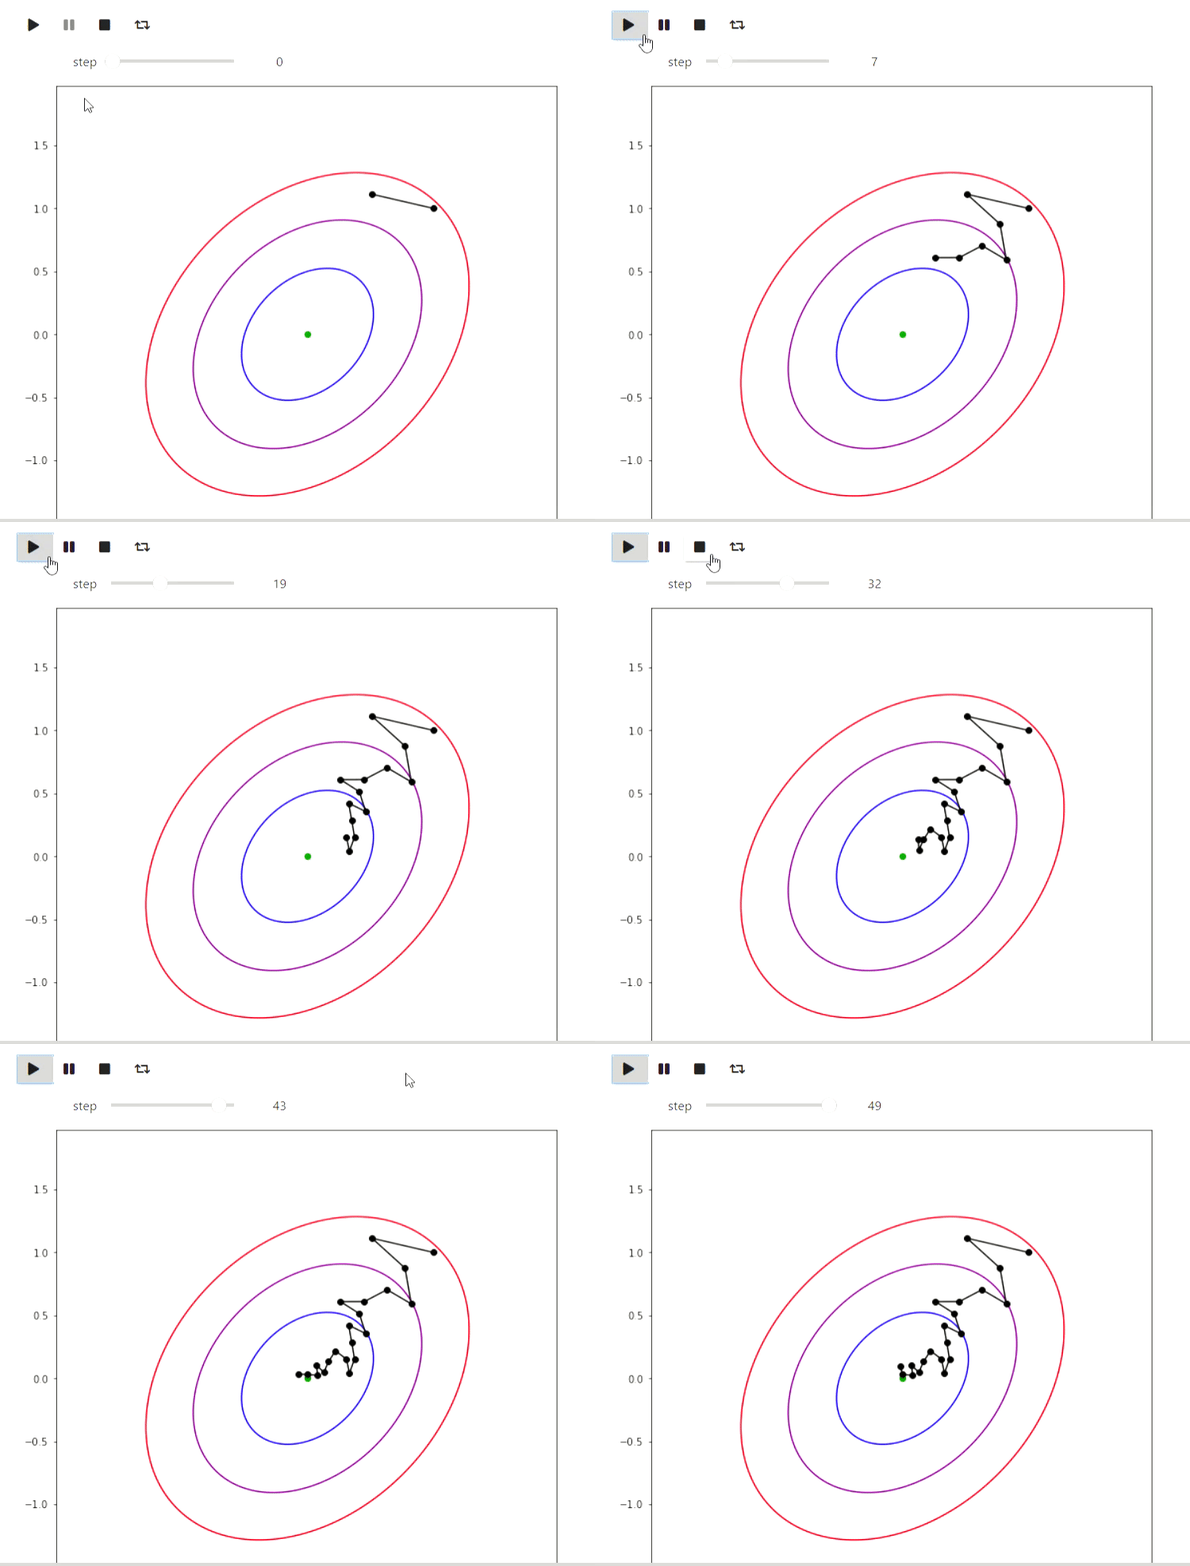
Matplotlib — библиотека Python для отрисовки различных графиков. Вот несколько примеров как можно её использовать для визуализации алгоритмов. Начнем с примера итеративных алгоритмов поиска минимума функции, наиболее простым из которых является метод случайного локального поиска, которые делает локальное изменение текущего приближения и переходит в него если значение значение функции в новой точки оказалось лучше:
import numpy as np
import matplotlib.pyplot as plt

# Функция, которую минимизируем, минимум в точке (0, 0)
def f(x, y):
    return 1.3 * (x - y) ** 2 + 0.7 * (x + y) ** 2

# Отрисовка траектории и линий уровня функции
def plot_trajectory(func, traj, limit_point=None):
    fig = plt.figure(figsize=(7, 7))
    ax = fig.add_axes([0, 0, 1, 1])

    if limit_point:
        ax.plot([limit_point[0]], [limit_point[1]], 'o', color='green')
    #Level contours
    delta = 0.025
    x = np.arange(-2, 2, delta)
    y = np.arange(-2, 2, delta)
    X, Y = np.meshgrid(x, y)
    Z = np.zeros_like(X)
    for i in range(X.shape[0]):
        for j in range(X.shape[1]):
            Z[i][j] = func(X[i][j], Y[i][j])
    CS = ax.contour(X, Y, Z, [0.5, 1.5, 3], colors=['blue', 'purple', 'red'])
    ax.plot([u[0] for u in traj], [u[1] for u in traj], color='black')
    ax.plot([u[0] for u in traj], [u[1] for u in traj], 'o', color='black')

    plt.close(fig)
    return fig

x, y = (1.0, 1.0)
num_iters = 50
trajectory = [(x, y)]
plots = []
# Итерируемся и сохраняем текущий путь на каждом шаге
for i in range(num_iters):
    angle = 2 * np.pi * np.random.rand(1)
    dx, dy = (np.cos(angle) / 2 / (i + 1) ** 0.5, np.sin(angle) / 2 / (i + 1) ** 0.5)
    trajectory.append((x + dx, y + dy))
    plots.append(plot_trajectory(f, trajectory, limit_point=(0, 0)))
    if f(x, y) > f(x + dx, y + dy):
        x = x + dx
        y = y + dy
    else:
        trajectory = trajectory[:-1]

animate_list(plots, play=True, interval=300);
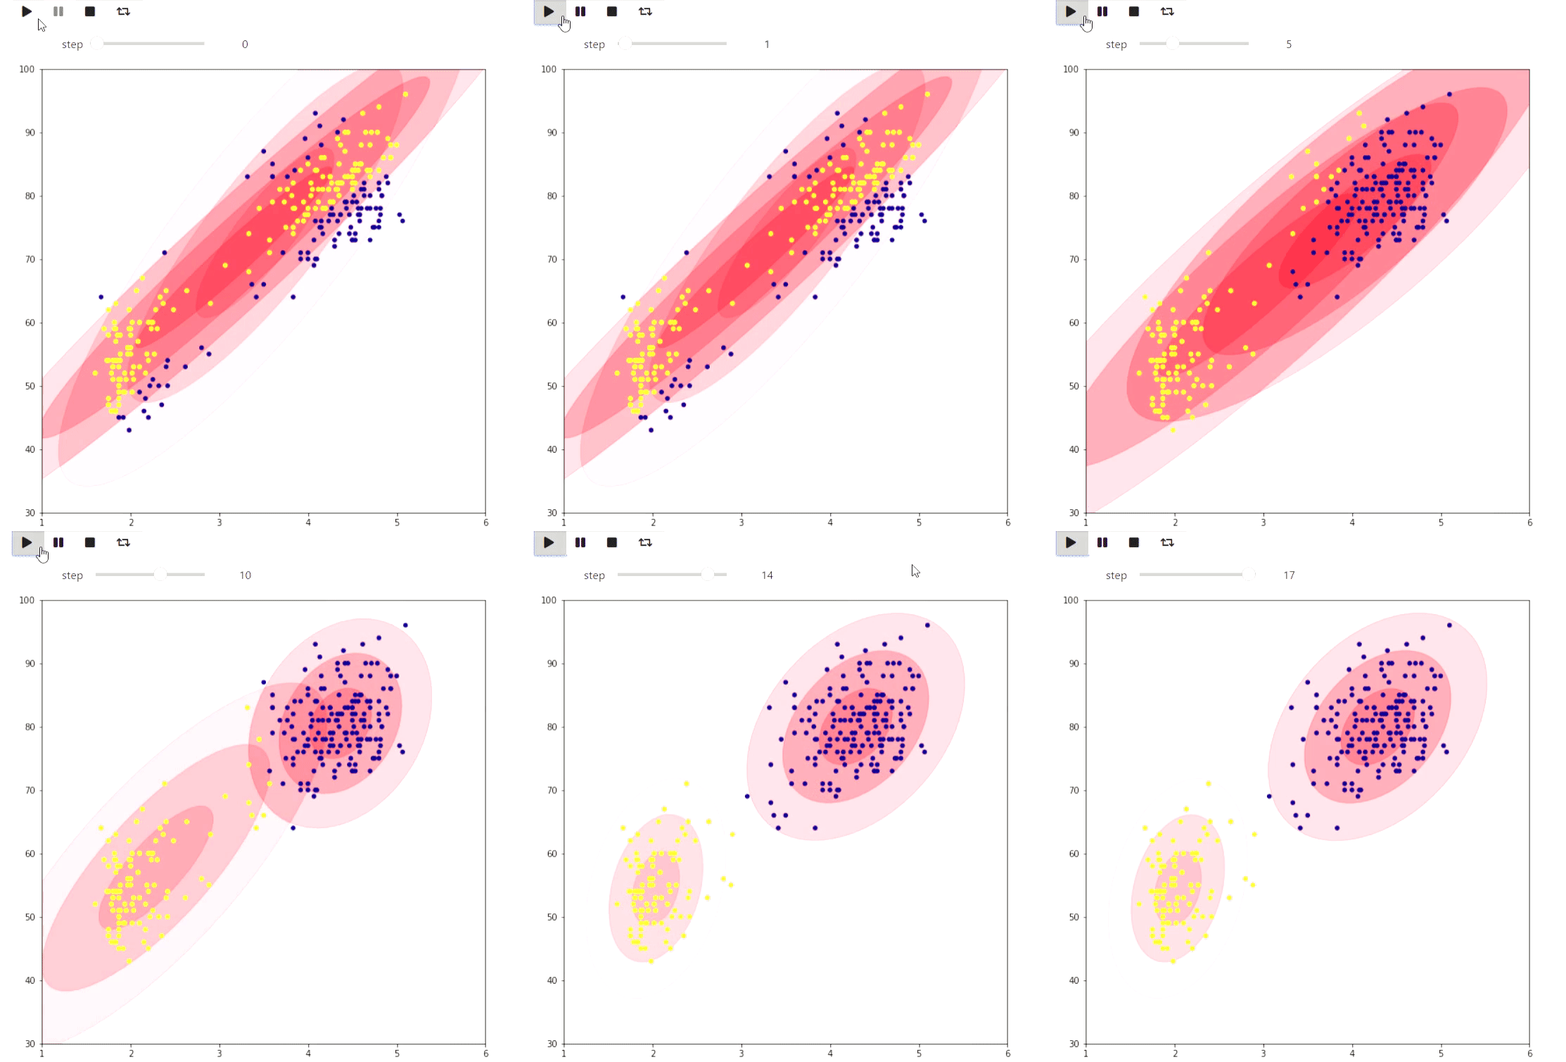
А вот пример ЕМ алгоритма для данных извержений Old Faithful гейзера, такой же пример приведен на википедии:
# Данные можно взять например здесь
# http://www.stat.cmu.edu/~larry/all-of-statistics/=data/faithful.dat
data = []
with open('data/faithful.csv') as f:
    for line in f:
        _, x, y = line.split(',')
        try:
            data.append((float(x), float(y)))
        except ValueError:
            pass

colors = ['red', 'blue', 'yellow', 'green']

# За основу взято https://jakevdp.github.io/PythonDataScienceHandbook/05.12-gaussian-mixtures.html
from matplotlib.patches import Ellipse

def draw_ellipse(position, covariance, ax=None, **kwargs):
    """Draw an ellipse with a given position and covariance"""
    ax = ax or plt.gca()

    # Convert covariance to principal axes
    if covariance.shape == (2, 2):
        U, s, Vt = np.linalg.svd(covariance)
        angle = np.degrees(np.arctan2(U[1, 0], U[0, 0]))
        width, height = 2 * np.sqrt(s)
    else:
        angle = 0
        width, height = 2 * np.sqrt(covariance)

    # Draw the Ellipse
    for nsig in range(1, 4):
        ax.add_patch(Ellipse(position, nsig * width, nsig * height,
                             angle, color='red', **kwargs))

def plot_gmm(gmm, X, label=True, ax=None):
    ax = ax or plt.gca()
    if label:
        labels = gmm.predict(X)
        ax.scatter(X[:, 0], X[:, 1], c=labels, s=20, cmap='plasma', zorder=2)
    else:
        ax.scatter(X[:, 0], X[:, 1], s=20, zorder=2)

    w_factor = 0.2 / gmm.weights_.max()
    for pos, covar, w in zip(gmm.means_, gmm.covariances_, gmm.weights_):
        draw_ellipse(pos, covar, alpha=w * w_factor)

def step_figure(gmm, X, label=True):
    fig = plt.figure(figsize=(7, 7))
    ax = fig.add_axes([0, 0, 1, 1])
    ax.set_ylim(30, 100)
    ax.set_xlim(1, 6)
    plot_gmm(gmm, X, label=True, ax=ax)
    plt.close(fig)
    return fig

from sklearn.mixture import GaussianMixture

x = np.array(data)
# max_iters=1 и warm_start=True заставляют gmm.fit делать ровно одну итерацию
# и сохранять состояние
gmm = GaussianMixture(2, warm_start=True, init_params='random', max_iter=1)
# GMM выдает предупреждения на то, что одной итерации мало
import warnings
warnings.simplefilter('ignore')
# Инициализируем на небольшой порции данных
gmm.fit(x[:10,:])
steps = [step_figure(gmm, x)]
for i in range(17):
    gmm.fit(x)
    steps.append(step_figure(gmm, x))

animate_list(steps, play=True, interval=400);
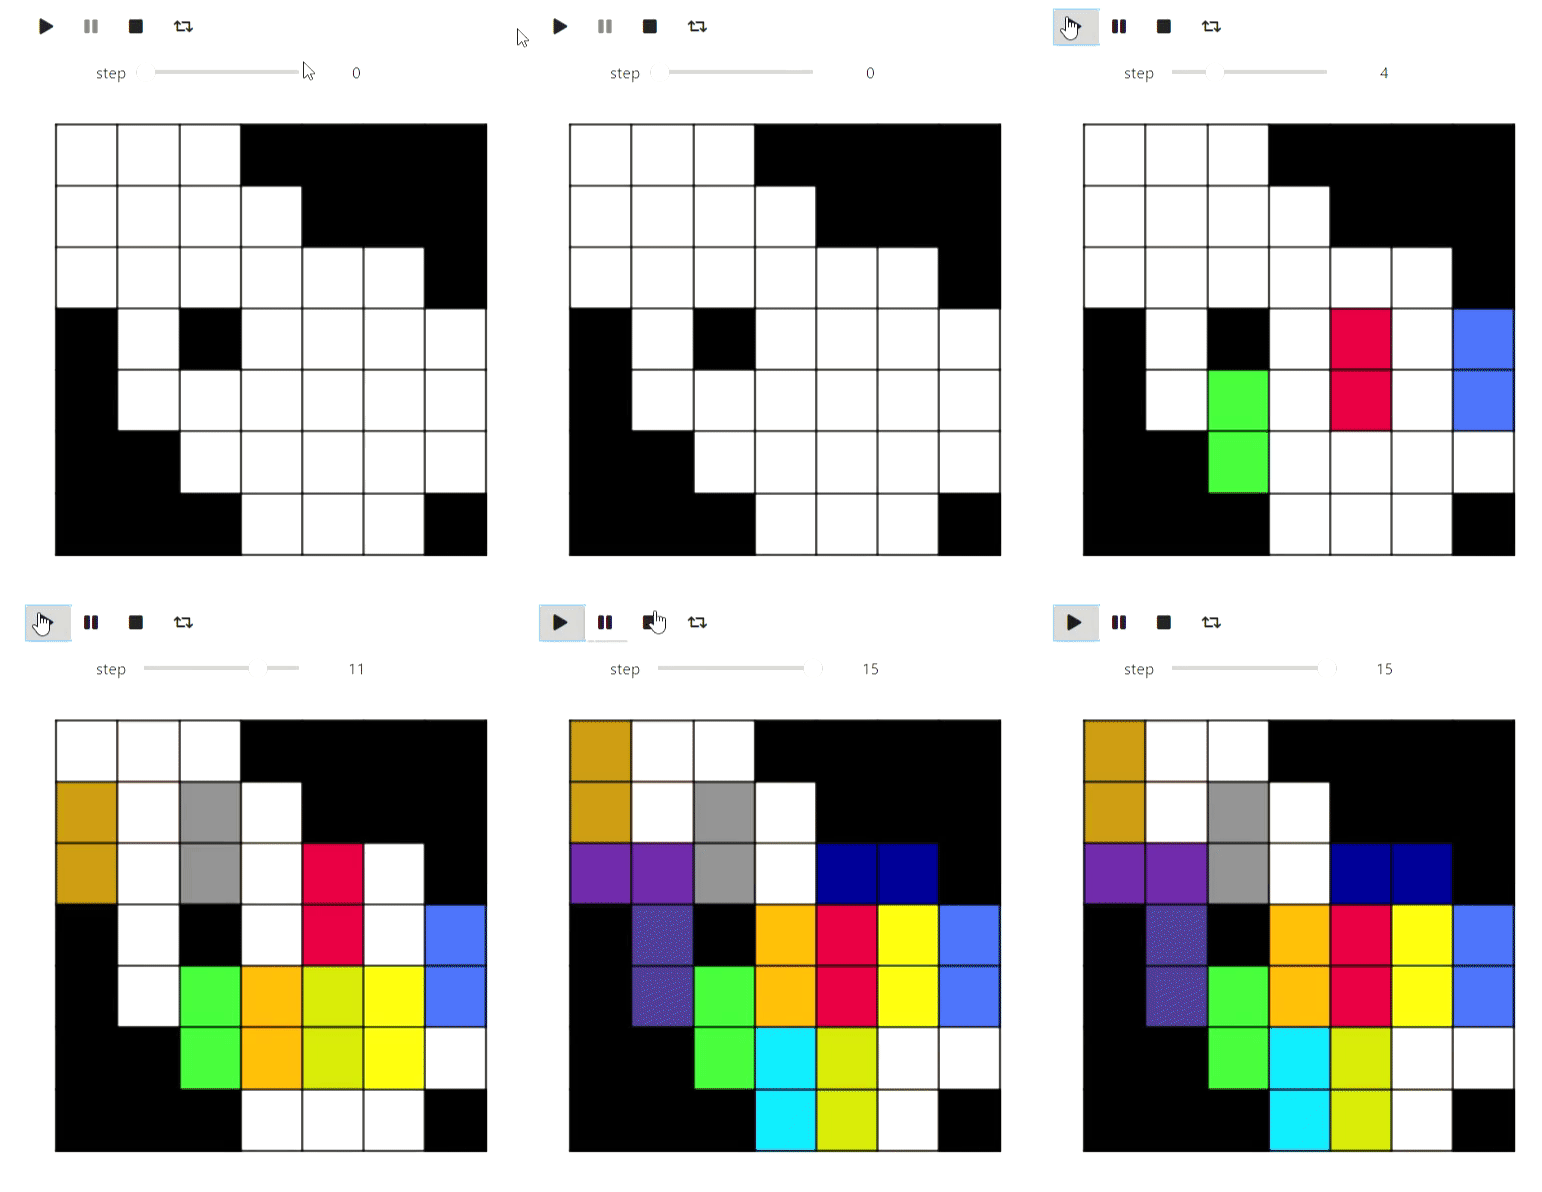
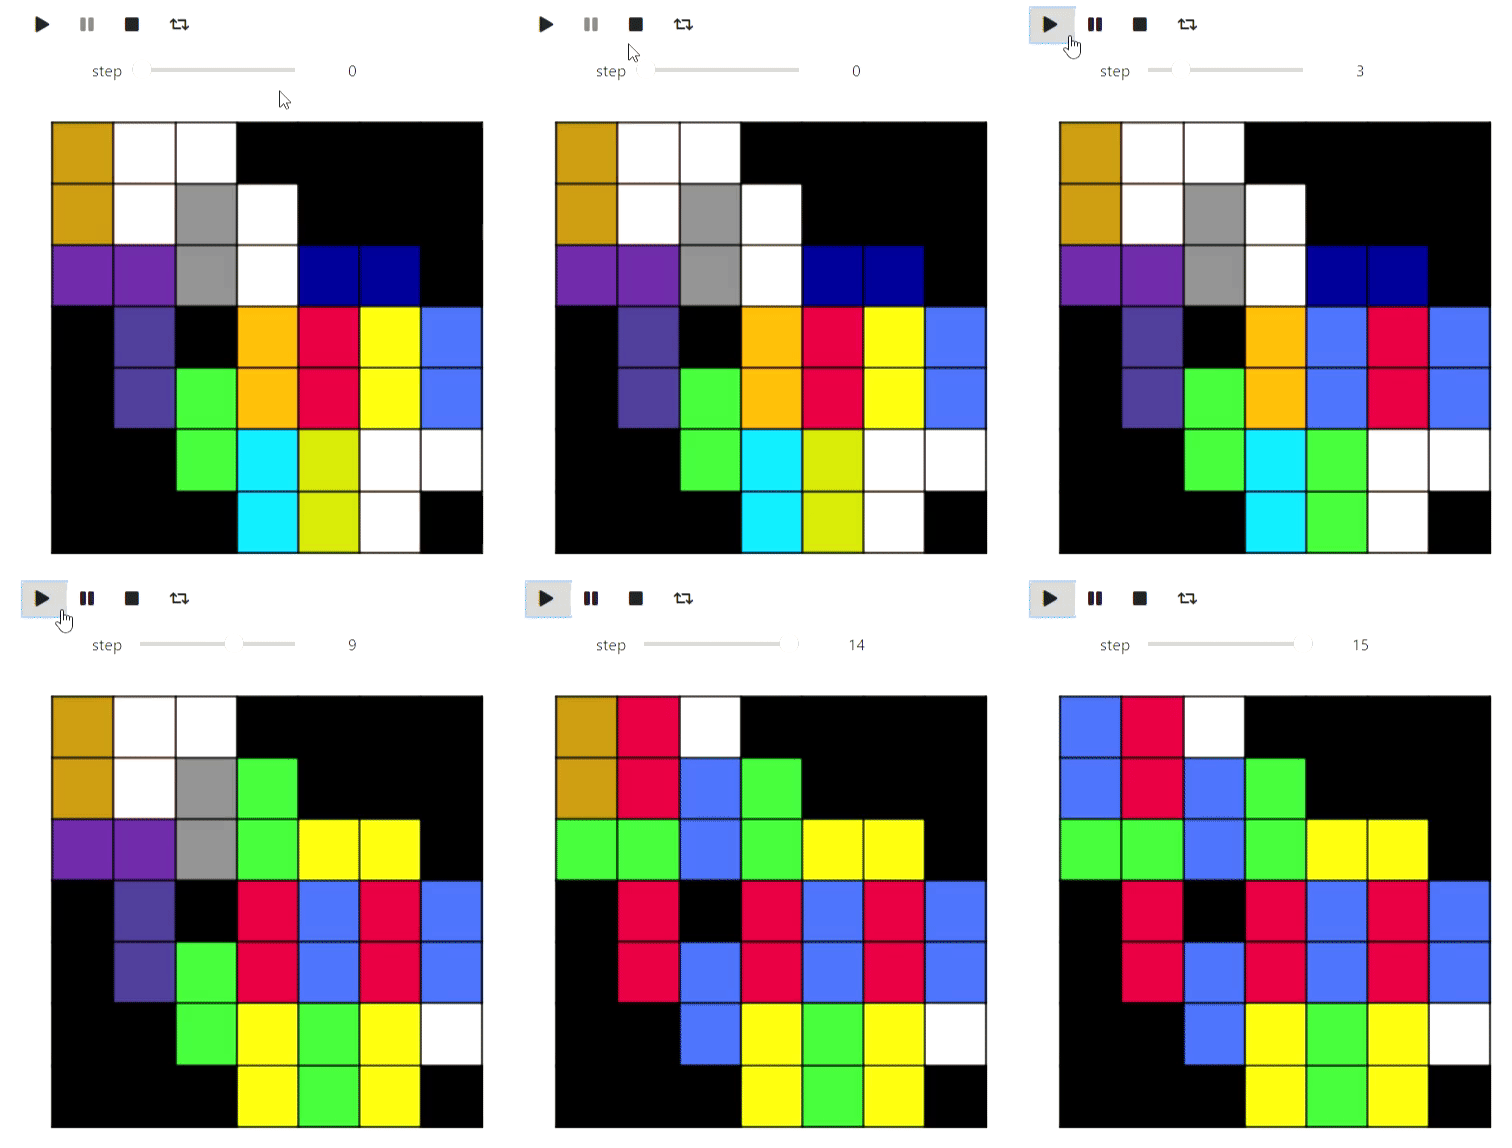
Следующий пример скорее игрушечный, но тоже показывает, что можно сделать в matplotlib: визуализация замощения клетчатой фигуры на плоскости максимальным числом доминошек с помощью нахождения максимального паросочетания:
# Обертка над matplotlib для отрисовки прямоугольника, разделенного на квадраты разных цветов
from animation_utils.matplotlib import draw_filling

def check_valid(i, j, n, m, tiling):
    return 0 <= i and i < n and 0 <= j and j < m and tiling[i][j] != '#'

def find_augmenting_path(x, y, n, m, visited, matched, tiling):
    if not check_valid(x, y, n, m, tiling):
        return False
    if (x, y) in visited:
        return False
    visited.add((x, y))

    for dx, dy in [(-1, 0), (1, 0), (0, -1), (0, 1)]:
        if not check_valid(x + dx, y + dy, n, m, tiling):
            continue
        if (x + dx, y + dy) not in matched or find_augmenting_path(*matched[(x + dx , y + dy)], n, m, visited, matched, tiling):
            matched[(x + dx, y + dy)] = (x, y)
            return True
    return False

def convert_match(matched, tiling, n, m):
    result = [[-1 if tiling[i][j] == '#' else -2 for j in range(m)] for i in range(n)]
    num = 0
    for x, y in matched:
        _x, _y = matched[(x, y)]
        result[x][y] = num
        result[_x][_y] = num
        num += 1
    return result

def match_with_flow(tiling):
    result_slices = []
    n = len(tiling)
    m = len(tiling[0])

    matched = dict()
    # Для наглядности визуализации
    rows = list(range(n))
    columns = list(range(m))
    random.shuffle(rows)
    random.shuffle(columns)
    result_slices.append(convert_match(matched, tiling, n, m))

    for i in rows:
        for j in columns:
            if (i + j) % 2 == 1:
                continue
            visited = set()
            if find_augmenting_path(i, j, n, m, visited, matched, tiling):
                result_slices.append(convert_match(matched, tiling, n, m))

    return result_slices

tiling_custom=[
    '...####',
    '....###',
    '......#',
    '#.#....',
    '#......',
    '##.....',
    '###...#',
]
sequencial_match = match_with_flow(tiling_custom)
animate_list(list(map(draw_filling, sequencial_match)), play=True);
Ну и попутно демонстрация алгоритма раскраски планарного графа в 5 цветов, чтобы визуально разбиение смотрелось лучше:
def color_5(filling):
    result = [[i for i in row] for row in filling]
    # Строим граф
    domino_tiles = [[] for i in range(max(map(max, filling)) + 1)]
    domino_neighbours = [set() for i in range(max(map(max, filling)) + 1)]
    degree = [0 for i in range(max(map(max, filling)) + 1)]

    n = len(filling)
    m = len(filling[0])

    for i, row in enumerate(filling):
        for j, num in enumerate(row):
            if num >= 0:
                domino_tiles[num].append((i, j))

    for i, tiles in enumerate(domino_tiles):
        for x, y in tiles:
            for dx, dy in [(-1, 0), (1, 0), (0, -1), (0, 1), (-1, -1), (-1, 1), (1, -1), (1, 1)]:
                a, b = x + dx, y + dy
                if 0 <= a and a < n and 0 <= b and b < m and filling[a][b] >= 0 and filling[a][b] != i                         and filling[a][b] not in domino_neighbours[i]:
                    domino_neighbours[i].add(filling[a][b])
                    degree[i] += 1

    # Первым делом нужно найти такой порядок вершин, все вершины имели не больше 5 соседей среди
    # предыдущих. Такой существует в силу того, что граф планарный, а найти его эффективнее всего
    # по очереди находя вершину наименьшей степени и удаляя её из графа, так мы получаем обратный порядок
    active_degrees = [set() for i in range(max(degree) + 1)]
    for i, deg in enumerate(degree):
        active_degrees[deg].add(i)

    reversed_order = []

    for step in range(len(domino_tiles)):
        min_degree = min([i for i, dominoes in enumerate(active_degrees) if len(dominoes) > 0])
        domino = active_degrees[min_degree].pop()

        reversed_order.append(domino)
        for other in domino_neighbours[domino]:
            if other in active_degrees[degree[other]]:
                active_degrees[degree[other]].remove(other)
                degree[other] -= 1
                active_degrees[degree[other]].add(other)

    # Теперь перебираем в обратном порядке и либо красим в еще не занятый цвет,
    # если есть свободный из 5 цветов, иначе находим цепочку из чередующихся цветов,
    # которые могут быть перекрашены. Такая найдется в силу планарности
    colors = [-1 for domino in domino_tiles]
    slices = [draw_filling(result)]
    for domino in reversed(reversed_order):
        used_colors = [colors[other] for other in domino_neighbours[domino] if colors[other] != -1]

        domino_color = len(used_colors)
        for i, color in enumerate(sorted(set(used_colors))):
            if i != color:
                domino_color = i
                break

        if domino_color < 5:
            colors[domino] = domino_color
            for x, y in domino_tiles[domino]:
                result[x][y] = domino_color

            slices.append(draw_filling(result))
            continue

        # Начиная отсюда код я не тестировал, не нашел примера
        c = 0
        other = [other for other in domino_neighbours[domino] if colors[other] == c]
        visited = set([other])
        q = Queue()
        q.put(other)
        domino_was_reached = False
        while not q.empty():
            cur = q.get()
            for other in domino_neighbours[cur]:
                if other == domino:
                    domino_was_reached = True
                    break
                if color[other] == c or color[other] == c + 1 and other not in visited:
                    visited.add(other)
                    q.put(other)

        if not domino_was_reached:
            for other in visited:
                color[other] = color[other] ^ 1
                for x, y in domino_tiles[other]:
                    result[x][y] = color[other]
            color[domino] = c
            for x, y in domino_tiles[domino]:
                result[x][y] = c

            slices.append(draw_filling(result))
            continue

        # Проделываем тоже самое для 2 и 3.
        c = 2
        other = [other for other in domino_neighbours[domino] if colors[other] == c]
        visited = set([other])
        q = Queue()
        q.put(other)
        domino_was_reached = False
        while not q.empty():
            cur = q.get()
            for other in domino_neighbours[cur]:
                if other == domino:
                    domino_was_reached = True
                    break
                if color[other] == c or color[other] == c + 1 and other not in visited:
                    visited.add(other)
                    q.put(other)
        for other in visited:
            color[other] = color[other] ^ 1
            for x, y in domino_tiles[other]:
                result[x][y] = color[other]
        color[domino] = c
        for x, y in domino_tiles[domino]:
            result[x][y] = c
        slices.append(draw_filling(result))

    return result, slices

filling_colored, slices =color_5(sequencial_match[-1])
animate_list(slices, play=True);
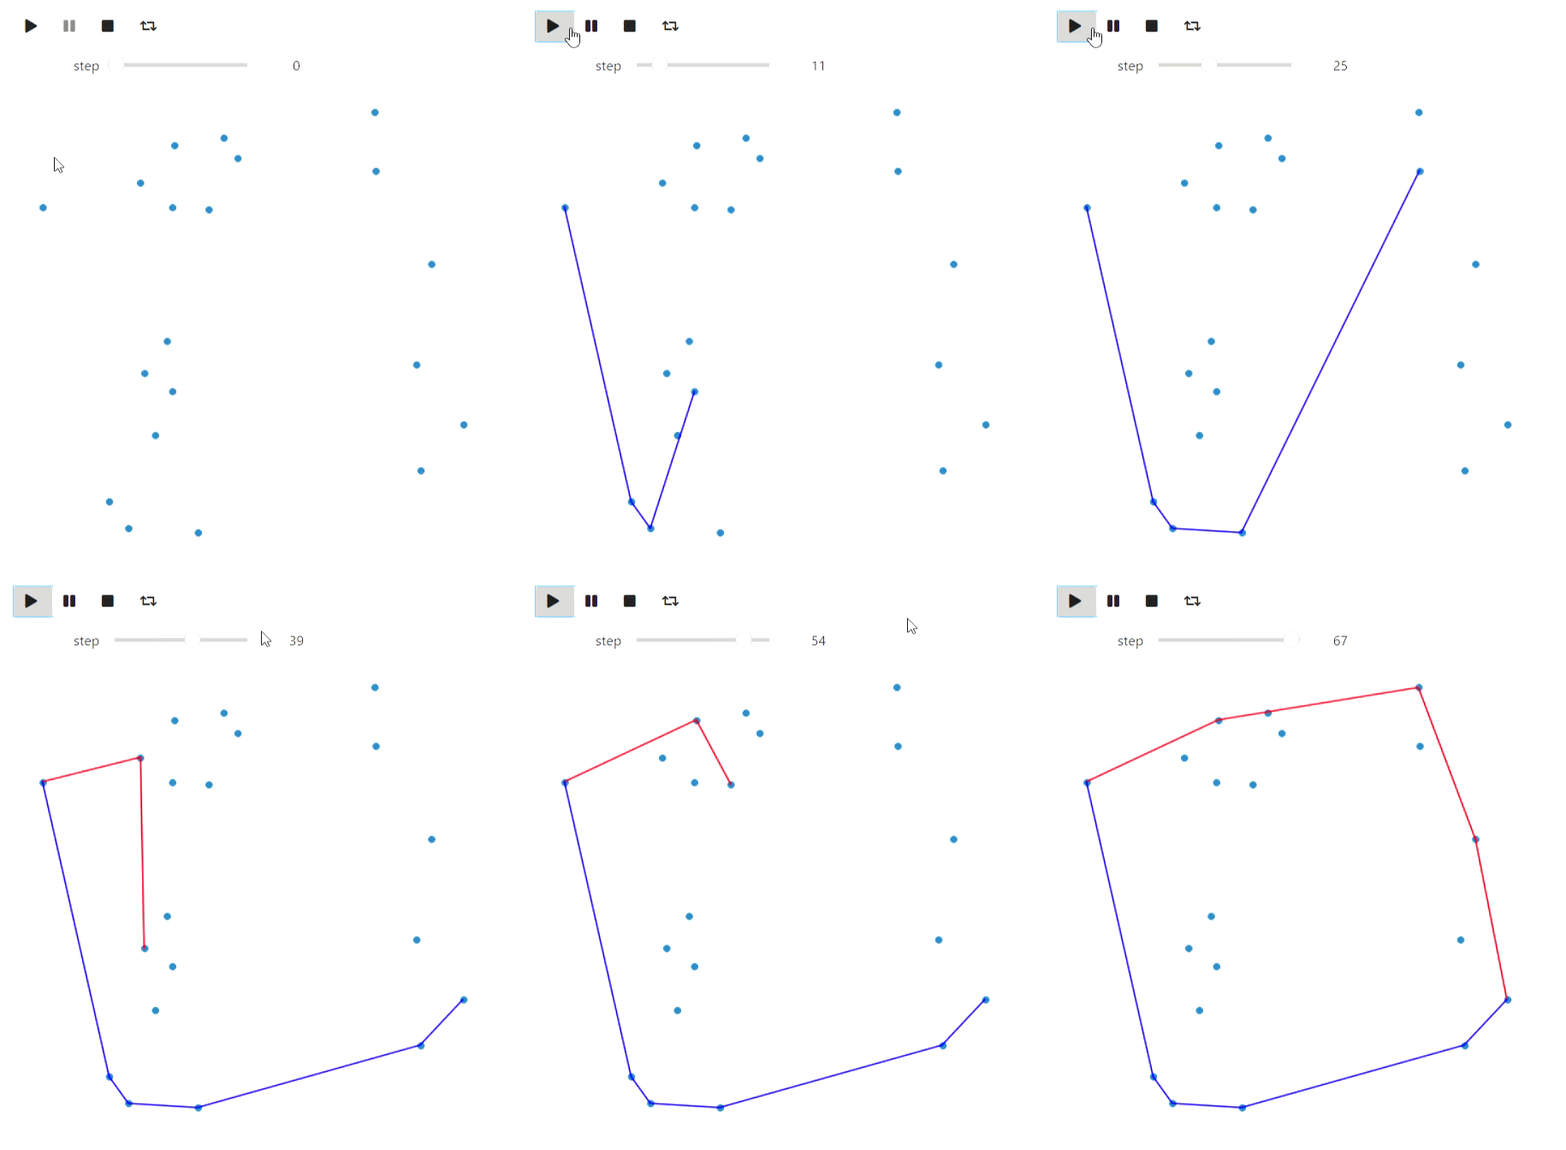
Последний пример с matplotlib из вычислительной геометрии — алгоритм Грэхэма-Эндрю для построения выпуклой оболочки на плоскости:
def convex_hull_state(points, lower_path, upper_path):
    fig = plt.figure(figsize=(6, 6))
    ax = fig.add_axes([0, 0, 1, 1])

    ax.get_xaxis().set_visible(False)
    ax.get_yaxis().set_visible(False)

    for name, spine in ax.spines.items():
        spine.set_visible(False)
        spine.set_visible(False)

    ax.scatter([x for x, y in points], [y for x, y in points])
    ax.plot([x for x, _ in lower_path], [y for _, y in lower_path], color='red')
    ax.plot([x for x, _ in upper_path], [y for _, y in upper_path], color='blue')

    plt.close(fig)
    return fig

def vector_prod(point_a, point_b):
    return point_a[0] *  point_b[1] - point_a[1] * point_b[0]

def convex_hull(poitns):
    sorted_points = sorted(points, key=lambda x: x[1])
    sorted_points = sorted(sorted_points, key=lambda x: x[0])
    states = []

    upper_path = [sorted_points[0]]
    lower_path = [sorted_points[0]]
    states.append(convex_hull_state(points, lower_path, upper_path))

    for point in sorted_points[1:]:
        while len(upper_path) > 1 and vector_prod(point - upper_path[-1], upper_path[-1] - upper_path[-2]) > 0:
            upper_path = upper_path[:-1]
            upper_path.append(point)
            states.append(convex_hull_state(poitns, lower_path, upper_path))
            upper_path = upper_path[:-1]
        upper_path.append(point)
        states.append(convex_hull_state(points, lower_path, upper_path))

    for point in sorted_points[1:]:
        while len(lower_path) > 1 and vector_prod(point - lower_path[-1], lower_path[-1] - lower_path[-2]) < 0:
            lower_path = lower_path[:-1]
            lower_path.append(point)
            states.append(convex_hull_state(poitns, lower_path, upper_path))
            lower_path = lower_path[:-1]
        lower_path.append(point)
        states.append(convex_hull_state(poitns, lower_path, upper_path))

    return states

points = [np.random.rand(2) for i in range(20)]
states = convex_hull(points)
animate_list(states, play=True, interval=300);
Последнее, что хотелось бы отметить в контексте matplotlib — это альтернативный способ создания анимаций через matplotlib.animation.FuncAnimation. У этого способа есть свои плюсы: его можно конвертировать в html с помощью IPython.display.HTML, результат будет более надежным, чем на виджетах (у меня виджеты периодически торомозят), не будет требовать рабочего ядра Jupyter, но в этом случае анимация стоновится обычным видео и средства управления ограничены проигрывателем.
Graphviz
С помощью graphviz можно отрисовывать графы. Обратите внимание, что для воспроизведения примеров с его помощью необходимо будет установить graphviz не только в python, но и в систему. Начнем с обхода в глубину:
# Обертка для упрощения работы с графами
from graph_utils.graph import Graph, Arc, Node

def enter_node(node):
    node.SetColor('blue')

def enter_arc(node, arc):
    node.SetColor('green')
    arc.attributes['style'] = 'dashed'
    arc.attributes['color'] = 'green'

def return_from_arc(node, arc):
    arc.attributes['style'] = 'solid'
    arc.attributes['color'] = 'red'
    node.SetColor('blue')

def ignore_arc(arc):
    arc.attributes['color'] = 'blue'

def leave_node(node):
    node.SetColor('red')

def dfs(graph, node_id, visited, outlist, path):
    visited.add(node_id)
    path.append(node_id)
    enter_node(graph.nodes[node_id])
    outlist.append(graph.Visualize())
    for arc in graph.nodes[node_id].arcs:
        if arc.end not in visited:
            enter_arc(graph.nodes[node_id], arc)
            dfs(graph, arc.end, visited, outlist, path)
            return_from_arc(graph.nodes[node_id], arc)
            path.append(node_id)
        else:
            ignore_arc(arc)
        outlist.append(graph.Visualize())
    leave_node(graph.nodes[node_id])

arcs = [
    Arc(1, 3, 3),
    Arc(1, 4, 7),
    Arc(4, 3, 2),
    Arc(4, 5, 3),
    Arc(1, 5, 2),
    Arc(6, 4, 2),
    Arc(5, 6, 2),
    Arc(6, 7, 1),
    Arc(7, 2, 7),
    Arc(4, 2, 2),
    Arc(3, 2, 5)
]

# Если следующий код выдает ошибку, что ему не удается выполнить `dot`, то
# скорее всего придется отдельно поставить graphviz
# https://graphviz.org/download/
graph = Graph(arcs)
visited = set()
dfs_outlist = []
path = []
dfs_outlist.append(graph.Visualize())
dfs(graph, 1, visited, dfs_outlist, path)
dfs_outlist.append(graph.Visualize())
animate_list(dfs_outlist, play=True, interval=400);
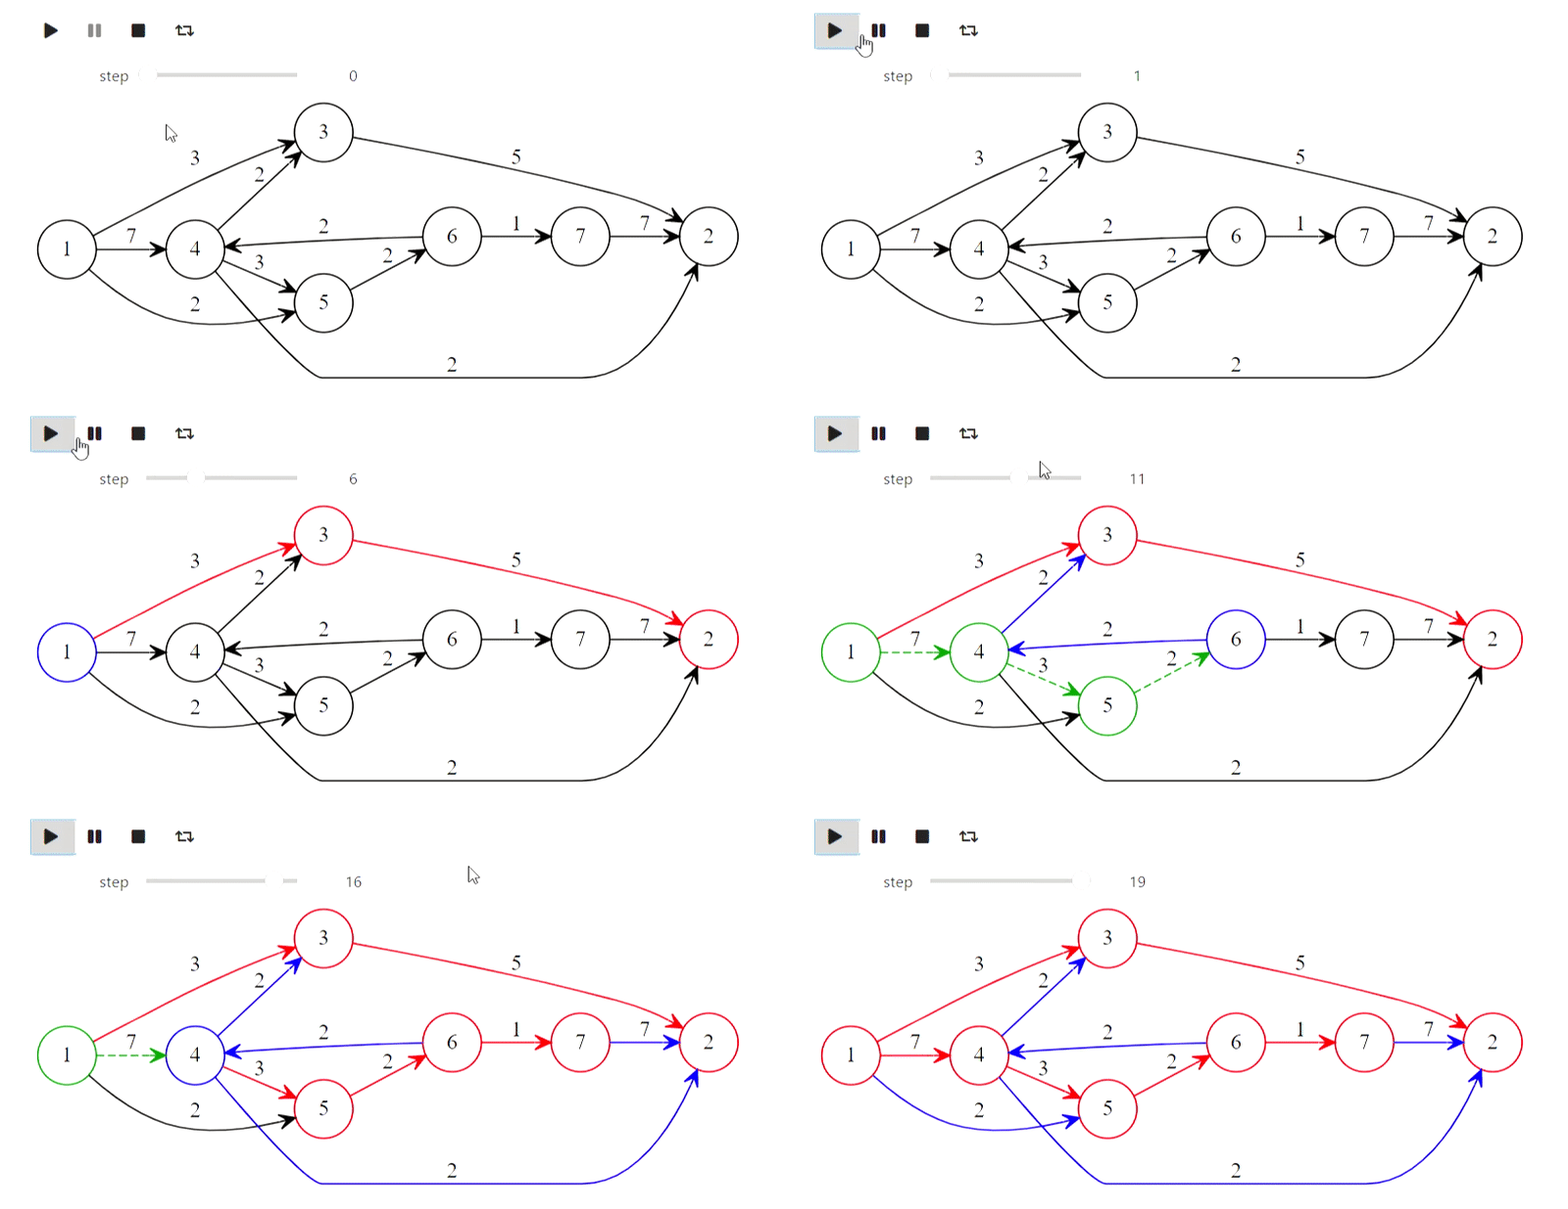
Ну а вот и алгоритм Дейкстры из заголовка
def mark_labelled(node):
    node.SetColor('red')

def mark_scanned(node):
    node.SetColor('green')

def process_node(node):
    node.SetColor('blue')

def set_previous(arc):
    arc.SetColor('green')

def unset_previous(arc):
    arc.SetColor('black')

def scan_arc(graph, arc, l, p, mark):
    if l[arc.end] > l[arc.beginning] + arc.weight:
        l[arc.end] = l[arc.beginning] + arc.weight
        if p[arc.end] is not None:
            unset_previous(p[arc.end])
        # Сохраняем arc, а не arc.beginning, чтобы было больше информации
        p[arc.end] = arc
        set_previous(p[arc.end])
        mark[arc.end] = True
        mark_labelled(graph.nodes[arc.end])

def scan_node(graph, node_id, l, p, mark):
    for arc in graph.nodes[node_id].arcs:
        scan_arc(graph, arc, l, p, mark)
    mark[node_id] = False
    mark_scanned(graph.nodes[node_id])


# Это не традиционная реализация алгоритма Дейкстры, а реализация
# сканирующего метода, подробности смотрите тут
# http://forskning.diku.dk/PATH05/GoldbergSlides.pdf
def base_scanning_method(graph, s, choice_function):
    l    = {key: float('Inf') for key in graph.nodes.keys()}
    p    = {key: None for key in graph.nodes.keys()}
    mark = {key: False for key in graph.nodes.keys()}

    l[s] = 0
    mark[s] = True
    mark_labelled(graph.nodes[s])

    out_lst = []

    while True:
        node_id = choice_function(l, mark)
        if node_id is None:
            break
        process_node(graph.nodes[node_id])
        out_lst.append(graph.Visualize(l))
        scan_node(graph, node_id, l, p, mark)
        out_lst.append(graph.Visualize(l))
    return l, p, out_lst

# Функция выбора в алгоритме Дейкстры
def least_distance_choice(l, mark):
    labelled = [node_id for node_id, value in mark.items() if value == True]
    if len(labelled) == 0:
        return None
    return min(labelled, key=lambda x: l[x])

graph = Graph(arcs)
l, p, bfs_shortest_path_lst =     base_scanning_method(graph, 1, least_distance_choice)
animate_list(bfs_shortest_path_lst, play=True, interval=400);

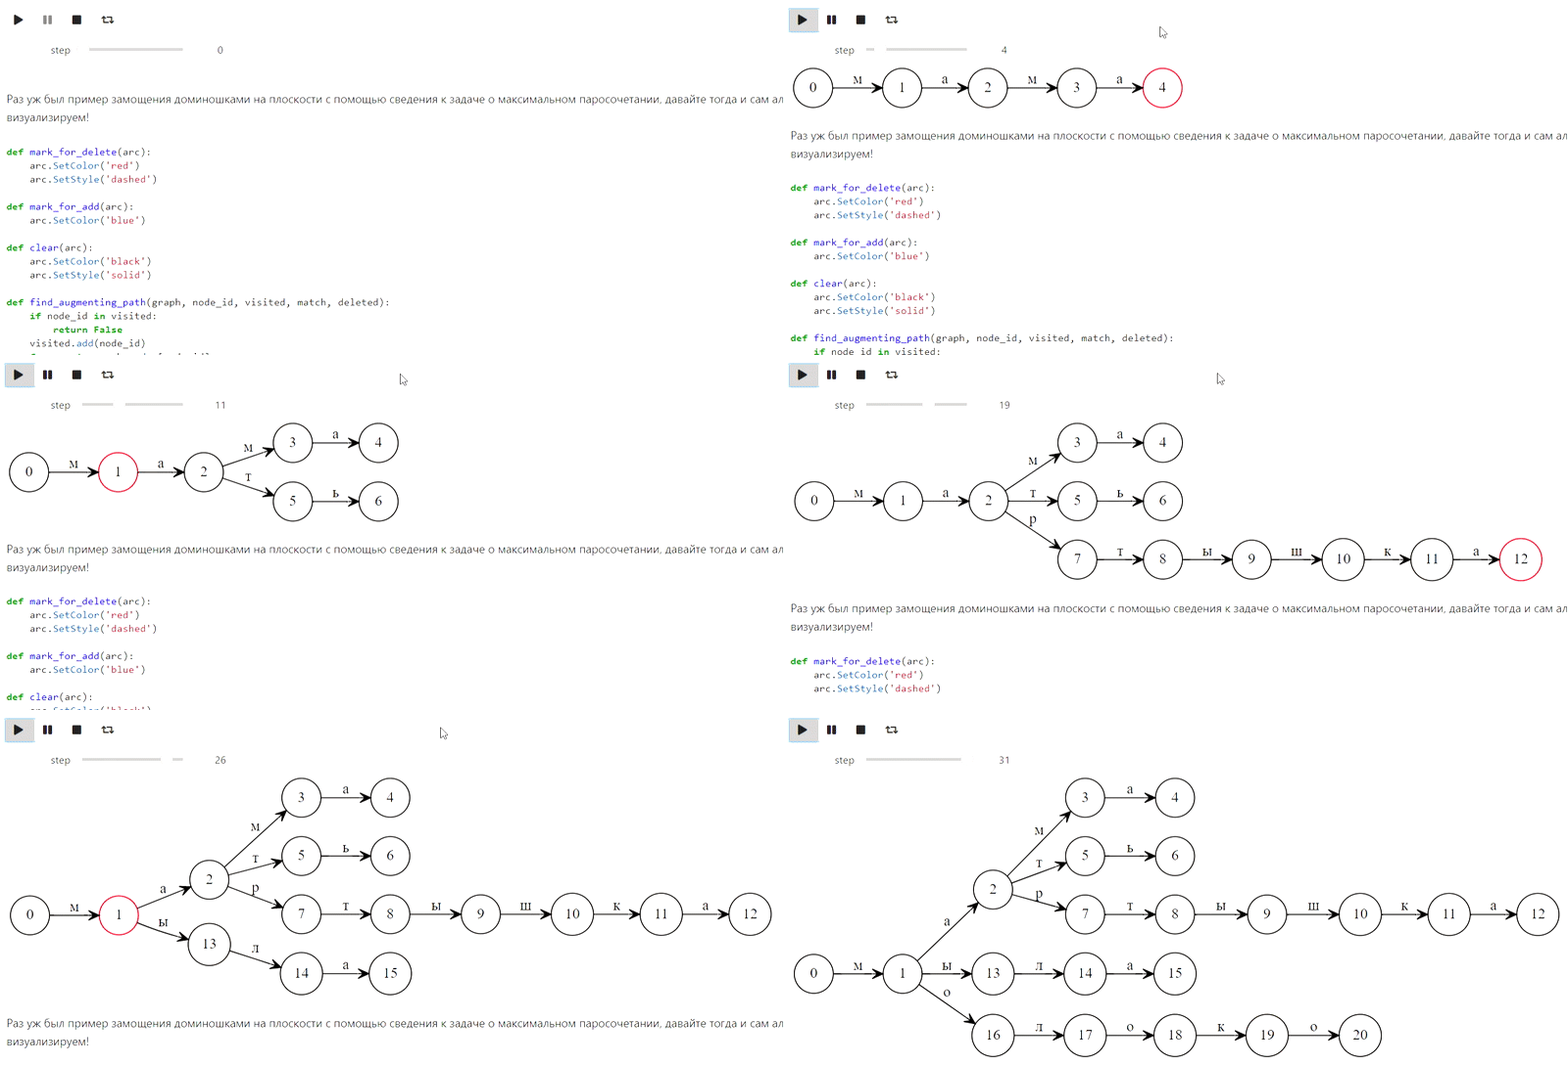
А вот таким образом происходит построение префиксного дерева для слов 'мама', 'мать', 'мартышка', 'мыла', 'молоко':
class TrieNode:
    def __init__(self, parent, word=None):
        # Хранение этого поля очень расточительно, используется исключительно
        # для демонстрации ленивого подсчета суффиксных ссылок
        self.parent = parent
        # Здесь аналогично, это поле чаще всего избыточно
        self.word = word
        self.children = {}
        self.suff_link = None

def init_trie():
    trie = [TrieNode(-1)]
    return trie

def to_graph(trie):
    arcs = []
    for i, node in enumerate(trie):
        for c, nextstate in node.children.items():
            arcs.append(Arc(i, nextstate, c))
        if node.suff_link is not None and node.suff_link != 0:
            arcs.append(Arc(i,
                            node.suff_link,
                            attributes={"constraint" : "False", "style" : "dashed"}))

    return Graph(arcs)

def add_word(trie, word, steps):
    _num = 0
    for ch in word:
        if not ch in trie[_num].children:
            _n = len(trie)
            trie[_num].children[ch] = _n
            trie.append(TrieNode((_num, ch)))
        _num = trie[_num].children[ch]
        graph = to_graph(trie)
        graph.nodes[_num].SetColor('red')
        steps.append(graph.Visualize())
    trie[_num].word = word

def make_trie(words):
    steps = []
    trie = init_trie()
    steps.append(to_graph(trie).Visualize())
    for word in words:
        add_word(trie, word, steps)
        steps.append(to_graph(trie).Visualize())
    return trie, steps

words = [
    'мама',
    'мать',
    'мартышка',
    'мыла',
    'молоко'
]
trie, steps = make_trie(words)
animate_list(steps, play=True, interval=500);
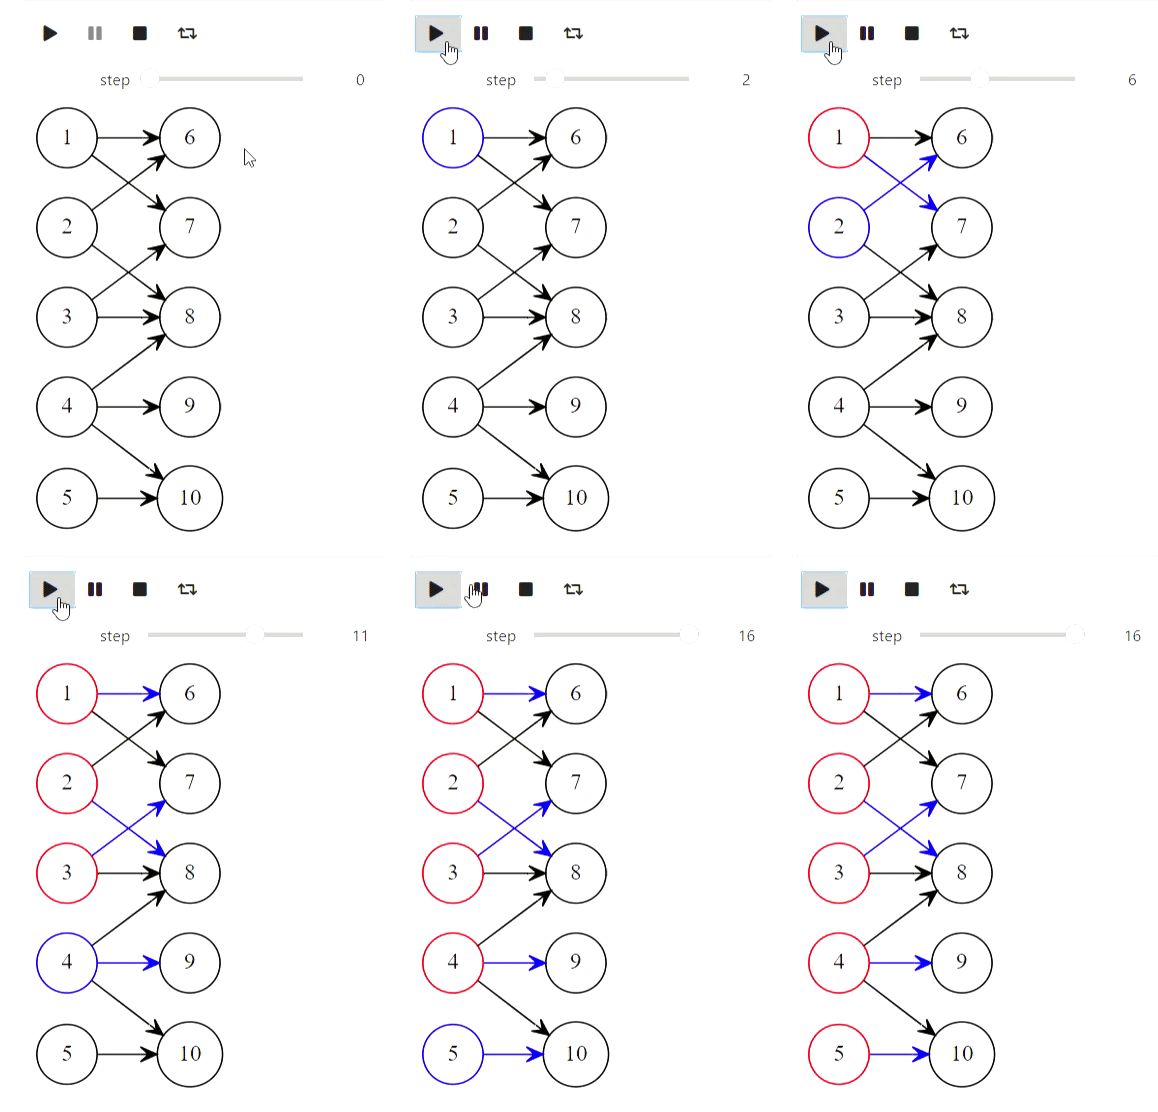
Ну и напоследок алгоритм Куна для нахождения максимального паросочетания:
def mark_for_delete(arc):
    arc.SetColor('red')
    arc.SetStyle('dashed')

def mark_for_add(arc):
    arc.SetColor('blue')

def clear(arc):
    arc.SetColor('black')
    arc.SetStyle('solid')

def find_augmenting_path(graph, node_id, visited, match, deleted):
    if node_id in visited:
        return False
    visited.add(node_id)
    for arc in graph.nodes[node_id].arcs:
        if arc.end not in match or find_augmenting_path(graph, match[arc.end].beginning, visited, match, deleted):
            if arc.end in match:
                mark_for_delete(match[arc.end])
                deleted.append(match[arc.end])
            match[arc.end] = arc
            mark_for_add(arc)
            return True
    return False

def kuhns_matching(graph, first_part):
    states = [graph.Visualize()]
    match = dict()
    for node_id in first_part:
        node = graph.nodes[node_id]
        node.SetColor('Blue')
        states.append(graph.Visualize())
        deleted = []
        if find_augmenting_path(graph, node_id, set(), match, deleted):
            states.append(graph.Visualize())
            for arc in deleted:
                clear(arc)
            states.append(graph.Visualize())
        node.SetColor('red')
    states.append(graph.Visualize())
    return states

arcs = [
    Arc(1, 6),
    Arc(1, 7),
    Arc(2, 6),
    Arc(3, 7),
    Arc(3, 8),
    Arc(4, 8),
    Arc(4, 9),
    Arc(4, 10),
    Arc(5, 10),
    Arc(2, 8)
]
first_part = [1, 2, 3, 4, 5]
graph = Graph(arcs)
states = kuhns_matching(graph, first_part)

animate_list(states, play=True, interval=400);
Алгоритмы с матрицами
А вот эта часть относится к неудавшейся попытке. IPython.display умеет парсить latex, однако при попытки его использовать вот что у меня получилось (должен был быть метод Гаусса):
from animation_utils.latex import Matrix
from IPython.display import Math

n = 5
A = np.random.rand(n, n)
L = np.identity(n)
U = np.array(A)
steps = []
steps.append(Math(str(Matrix(L)) + str(Matrix(U))))
for k in range(n):
    x = U[k,k]
    for i in range(k+1, n):
        L[i,k] = U[i,k] / x
        U[i,k:] -= L[i,k] * U[k,k:]
    steps.append(Math(str(Matrix(L)) + str(Matrix(U))))

animate_list(steps, play=True, interval=500);

Пока я не знаю, что с этим делать, но возможно знающие люди подскажут.


uchitel
Классная статья. Тема виджетов вообще не особо где всплывает, хотя в некоторых ситуациях бывает очень полезной. Если не ошибаюсь, тот же seaborn использует их для подбора цветовой палитры.