We’re happy to announce today the release of the C++ Build Insights SDK, a framework that gives you access to MSVC build time information via C and C++ APIs. To accompany this release, we are making vcperf open source on GitHub. Because vcperf itself is built with the SDK, you can use it as a reference when developing your own tools. We’re excited to see what sort of applications you’ll be building with the SDK, and we’re looking forward to receiving your feedback!

Last November, we introduced vcperf and its Windows Performance Analyzer (WPA) plugin to help MSVC users understand their build times. Both components were announced under the umbrella of C++ Build Insights. But what is C++ Build Insights, really?
We’ve already covered in November that C++ Build Insights is based on Event Tracing for Windows (ETW), the convenient tracing mechanism available in the Windows operating system. But for our technology to scale to the very large C++ builds done by our customers, ETW wasn’t enough. We needed to fine-tune the event model and analysis algorithms used. This work resulted in a new data analysis platform for MSVC that we now call C++ Build Insights.
Today, the C++ Build Insights platform is what powers vcperf and some of our internal tools. However, we wanted to give all of you the opportunity to benefit from it, too. To this end, we packaged it up behind C and C++ interfaces to create a full-fledged software development kit.
Use the C++ Build Insights SDK to build custom tools that fit your scenarios:
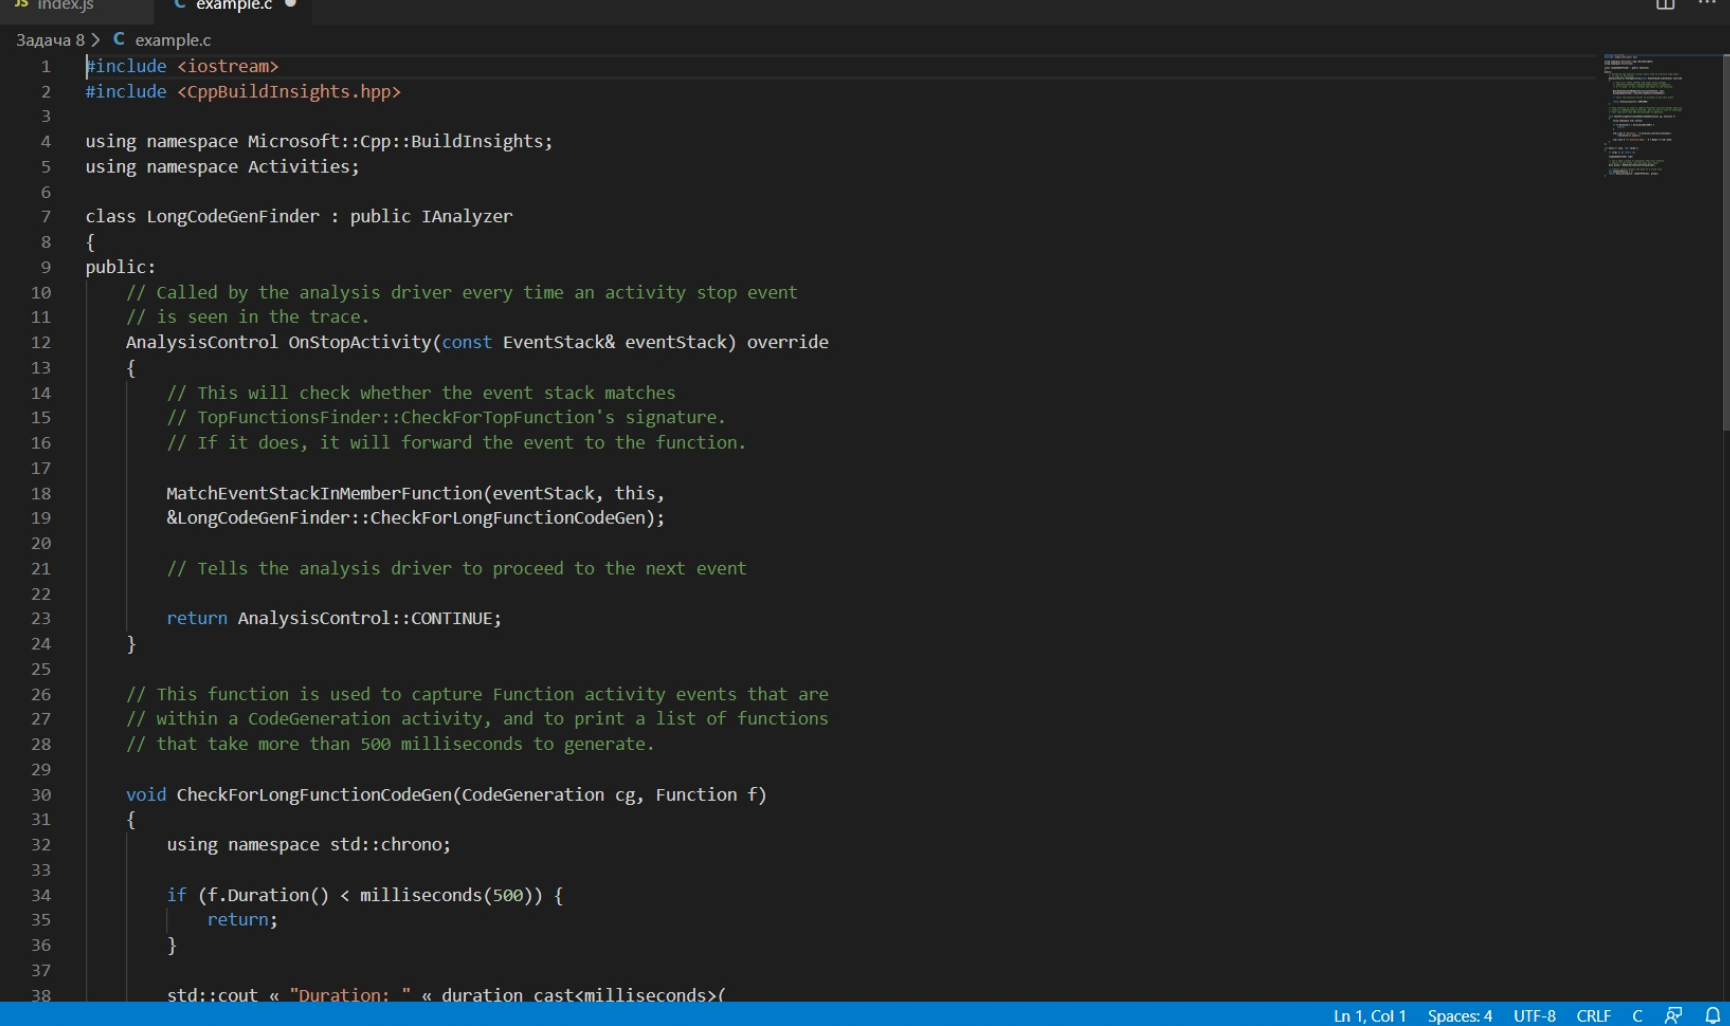
Here is how you can get started with the SDK. This example shows how to build a program that lists all functions taking more than 500 milliseconds to generate.

A cloneable and buildable version of this sample is also available on our C++ Build Insights samples GitHub repository.
Note that it’s also possible to obtain a trace programmatically instead of through vcperf by using the SDK. See the official C++ Build Insights SDK documentation for details.
vcperf itself is built using the C++ Build Insights SDK, and we are making it open-source today on GitHub. We hope you will be able to use it to learn more about the SDK, and to customize vcperf to your own needs. The repository includes an example commit that extends vcperf to detect linkers that were restarted due to error conditions. The example highlights these invocations in C++ Build Insights’ Build Explorer view in WPA. We recommend reading this sample commit in the following order:
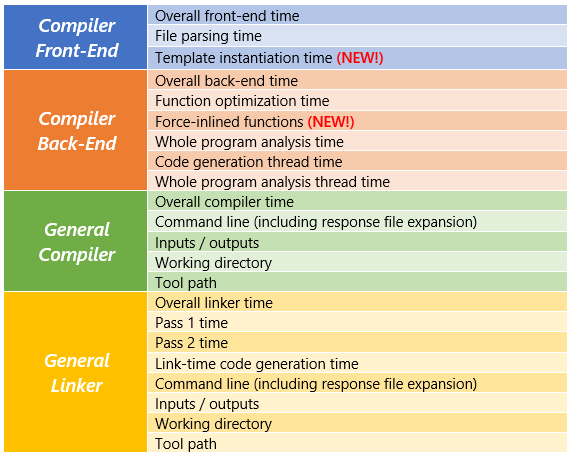
A reason why you might want to build and run vcperf from GitHub today is to gain access to new events that are not yet supported in the released version of vcperf, including the new template instantiation events. Note that vcperf is not tied to any particular version of Visual Studio, but that the new events are only supported in Visual Studio 2019 version 16.4 and above. Here is the updated event table:

We hope you will enjoy the release of the C++ Build Insights SDK, as well as the open-source version of vcperf. Download Visual Studio 2019 today and get started on your first C++ Build Insights application.
In this article, we shared a simple example on how to use the SDK to identify functions taking a long time to generate in your entire build. We also pointed you to useful resources for customizing vcperf. Stay tuned for more examples and code samples in future blog posts!
Would you like the SDK to support additional events? What are some of the ways you have customized vcperf to your needs? Please let us know in the comments below, on Twitter (@VisualC), or via email at visualcpp@microsoft.com.

Background
Last November, we introduced vcperf and its Windows Performance Analyzer (WPA) plugin to help MSVC users understand their build times. Both components were announced under the umbrella of C++ Build Insights. But what is C++ Build Insights, really?
We’ve already covered in November that C++ Build Insights is based on Event Tracing for Windows (ETW), the convenient tracing mechanism available in the Windows operating system. But for our technology to scale to the very large C++ builds done by our customers, ETW wasn’t enough. We needed to fine-tune the event model and analysis algorithms used. This work resulted in a new data analysis platform for MSVC that we now call C++ Build Insights.
Today, the C++ Build Insights platform is what powers vcperf and some of our internal tools. However, we wanted to give all of you the opportunity to benefit from it, too. To this end, we packaged it up behind C and C++ interfaces to create a full-fledged software development kit.
Get started with the C++ Build Insights SDK
Use the C++ Build Insights SDK to build custom tools that fit your scenarios:
- Analyze traces programmatically rather than through WPA.
- Add build time analysis into your continuous integration (CI).
- Or just have fun!
Here is how you can get started with the SDK. This example shows how to build a program that lists all functions taking more than 500 milliseconds to generate.

- Download and install a copy of Visual Studio 2019.
- Obtain a trace of your build.
- Launch an x64 Native Tools Command Prompt for VS 2019.
- Run the following command: vcperf /start MySessionName
- Build your C++ project from anywhere, even from within Visual Studio (vcperf collects events system-wide).
- Run the following command: vcperf /stopnoanalyze MySessionName outputFile.etl. This will save a trace of your build in outputFile.etl.
- Launch Visual Studio and create a new C++ project.
- Right-click on your project’s name, select Manage NuGet packages… and install the latest Microsoft.Cpp.BuildInsights NuGet package from the official nuget.org feed. You will be prompted to accept the license.
- Type in the following code.
- Build and run by passing the path to outputFile.etl as the first argument.
#include <iostream>
#include <CppBuildInsights.hpp>

using namespace Microsoft::Cpp::BuildInsights;
using namespace Activities;

class LongCodeGenFinder : public IAnalyzer
{
public:
    // Called by the analysis driver every time an activity stop event
    // is seen in the trace.
    AnalysisControl OnStopActivity(const EventStack& eventStack) override
    {
        // This will check whether the event stack matches
        // TopFunctionsFinder::CheckForTopFunction's signature.
        // If it does, it will forward the event to the function.

        MatchEventStackInMemberFunction(eventStack, this,
            &LongCodeGenFinder::CheckForLongFunctionCodeGen);

        // Tells the analysis driver to proceed to the next event

        return AnalysisControl::CONTINUE;
    }

    // This function is used to capture Function activity events that are
    // within a CodeGeneration activity, and to print a list of functions
    // that take more than 500 milliseconds to generate.

    void CheckForLongFunctionCodeGen(CodeGeneration cg, Function f)
    {
        using namespace std::chrono;

        if (f.Duration() < milliseconds(500)) {
            return;
        }

        std::cout << "Duration: " << duration_cast<milliseconds>(
            f.Duration()).count();

        std::cout << "\t Function Name: " << f.Name() << std::endl;
    }
};

int main(int argc, char *argv[])
{
    if (argc <= 1) return -1;

    LongCodeGenFinder lcgf;

    // Let's make a group of analyzers that will receive
    // events in the trace. We only have one; easy!
    auto group = MakeStaticAnalyzerGroup(&lcgf);

    // argv[1] should contain the path to a trace file
    int numberOfPasses = 1;
    return Analyze(argv[1], numberOfPasses, group);
}
A cloneable and buildable version of this sample is also available on our C++ Build Insights samples GitHub repository.
Note that it’s also possible to obtain a trace programmatically instead of through vcperf by using the SDK. See the official C++ Build Insights SDK documentation for details.
vcperf is now open source
vcperf itself is built using the C++ Build Insights SDK, and we are making it open-source today on GitHub. We hope you will be able to use it to learn more about the SDK, and to customize vcperf to your own needs. The repository includes an example commit that extends vcperf to detect linkers that were restarted due to error conditions. The example highlights these invocations in C++ Build Insights’ Build Explorer view in WPA. We recommend reading this sample commit in the following order:
- RestartedLinkerDetector.h
- BuildExplorerView.cpp
- Commands.cpp
A reason why you might want to build and run vcperf from GitHub today is to gain access to new events that are not yet supported in the released version of vcperf, including the new template instantiation events. Note that vcperf is not tied to any particular version of Visual Studio, but that the new events are only supported in Visual Studio 2019 version 16.4 and above. Here is the updated event table:

Tell us what you think!
We hope you will enjoy the release of the C++ Build Insights SDK, as well as the open-source version of vcperf. Download Visual Studio 2019 today and get started on your first C++ Build Insights application.
In this article, we shared a simple example on how to use the SDK to identify functions taking a long time to generate in your entire build. We also pointed you to useful resources for customizing vcperf. Stay tuned for more examples and code samples in future blog posts!
Would you like the SDK to support additional events? What are some of the ways you have customized vcperf to your needs? Please let us know in the comments below, on Twitter (@VisualC), or via email at visualcpp@microsoft.com.

